
Archimedean spiral: Difference between revisions
No edit summary |
→{{header|VBA}}: Excel VBA |
||
| Line 1,839: | Line 1,839: | ||
vwait forever ;# go into event loop until window is closed</lang> |
vwait forever ;# go into event loop until window is closed</lang> |
||
=={{header|VBA}}== |
|||
<lang vb>Private Sub plot_coordinate_pairs(x As Variant, y As Variant) |
|||
Dim chrt As Chart |
|||
Set chrt = ActiveSheet.Shapes.AddChart.Chart |
|||
With chrt |
|||
.ChartType = xlXYScatter |
|||
.HasLegend = False |
|||
.SeriesCollection.NewSeries |
|||
.SeriesCollection.Item(1).XValues = x |
|||
.SeriesCollection.Item(1).Values = y |
|||
End With |
|||
End Sub |
|||
Public Sub main() |
|||
Dim x(1000) As Single, y(1000) As Single |
|||
a = 1 |
|||
b = 9 |
|||
For i = 0 To 1000 |
|||
theta = i * WorksheetFunction.Pi() / 60 |
|||
r = a + b * theta |
|||
x(i) = r * Cos(theta) |
|||
y(i) = r * Sin(theta) |
|||
Next i |
|||
plot_coordinate_pairs x, y |
|||
End Sub</lang> |
|||
=={{header|Yabasic}}== |
=={{header|Yabasic}}== |
||
{{trans|Sinclair_ZX81_BASIC}} |
{{trans|Sinclair_ZX81_BASIC}} |
||
Revision as of 14:22, 29 January 2019

You are encouraged to solve this task according to the task description, using any language you may know.
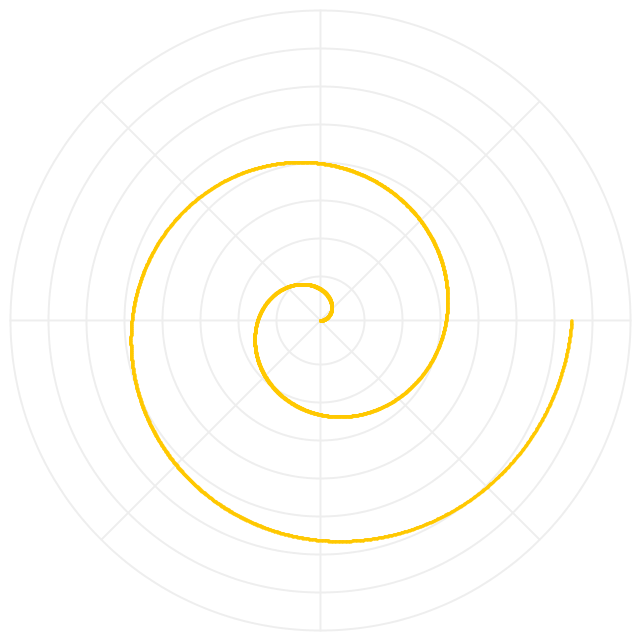
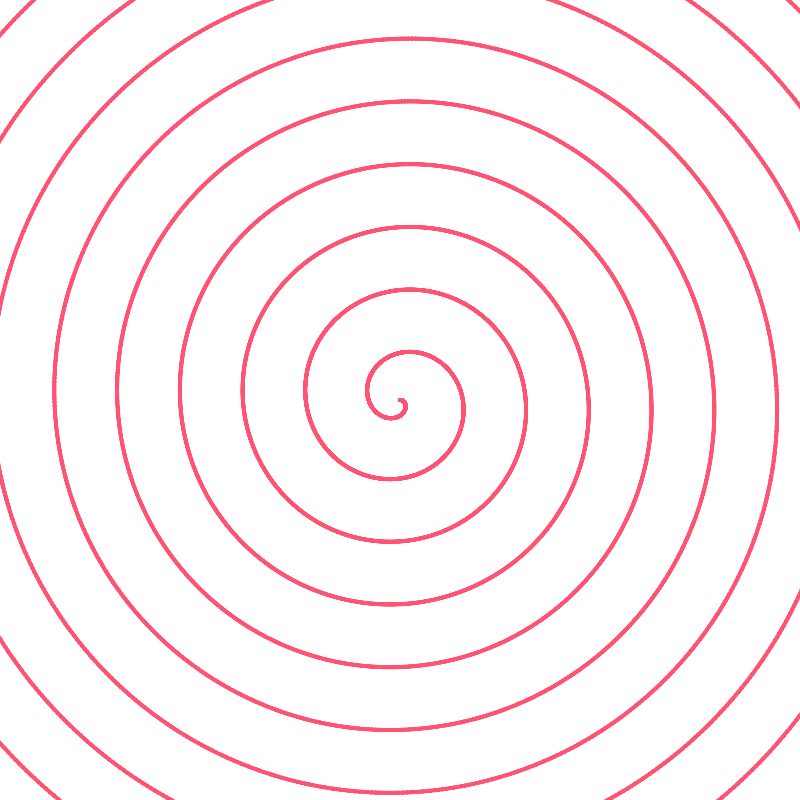
The Archimedean spiral is a spiral named after the Greek mathematician Archimedes.
An Archimedean spiral can be described by the equation:

with real numbers a and b.
- Task
Draw an Archimedean spiral.
AWK
<lang AWK>
- syntax: GAWK -f ARCHIMEDEAN_SPIRAL.AWK
- converted from Applesoft BASIC
BEGIN {
   x_min = y_min = 9999
   x_max = y_max = 0
   h = 96
   w = h + h / 2
   a = 1
   b = 1
   m = 6 * 3.1415926
   step = .02
   for (t=step; t<=m; t+=step) { # build spiral
     r = a + b * t
     x = int(r * cos(t) + w)
     y = int(r * sin(t) + h)
     if (x <= 0 || y <= 0) { continue }
     if (x >= 280 ) { continue }
     if (y >= 192) { continue }
     arr[x,y] = "*"
     x_min = min(x_min,x)
     x_max = max(x_max,x)
     y_min = min(y_min,y)
     y_max = max(y_max,y)
   }
   for (i=x_min; i<=x_max; i++) { # print spiral
     rec = ""
     for (j=y_min; j<=y_max; j++) {
       rec = sprintf("%s%1s",rec,arr[i,j])
     }
     printf("%s\n",rec)
   }
   exit(0)
} function max(x,y) { return((x > y) ? x : y) } function min(x,y) { return((x < y) ? x : y) } </lang>
- Output:
             **********
          ***          ***
         **              **
       **                  **
      **                    **
     **                      **
    **         *******        **
   **       ***      ***       *
   *       **          **      **
  **      **            **      *
  *      **              **     **
 **     **                *      *
 *      *       ****       *     *
 *     *      ***  **      *     **
**     *      *     **     *      *
*      *     **      *     *      *
*      *     *       *     *      *
*     **     *      **     *      *
*     **     *     **      *     **
*      *     *            **     *
*      *     *            *      *
**     *      *          **     **
 *     *      **        **      *
 *      *      ***    ***      **
 **     **       ******        *
  *      *                    **
  *      **                  **
   *       **               **
   **       **            **
    *        ****       ***
     *          ********
      *
       *
        **
         ***
           ****
              *****
BASIC
Applesoft BASIC
<lang ApplesoftBasic>110 LET H = 96 120 LET W = H + H / 2 130 HGR2 140 HCOLOR= 3 150 LET A = 1 160 LET B = 9 170 LET PI = 3.1415926535 180 LET M = 10 * PI 190 LET S = .02 200 FOR T = S TO M STEP S 210 LET R = A + B * T 220 LET X = R * COS (T) + W 230 LET Y = R * SIN (T) + H 240 IF X < 0 THEN 290 250 IF Y < 0 THEN 290 260 IF X > 279 THEN 290 270 IF Y > 191 THEN 290 280 HPLOT X,Y 290 NEXT </lang>
BASIC256
<lang BASIC256>
- Basic-256 ver 1.1.4
- Archimedean Spiral
width = 430 : height = 430 graphsize width, height rect 0,0, graphwidth,graphheight penwidth 1 color green
x = width/2 : y = height/2 # Center of graphics window i = 1 : t = 0 : xn = 0 : yn = 0 # Initial values iter = 150 : q = 30
line x,0,x,height
line 0,y,width,y
penwidth 2 color red
while i <= iter
   t = i / q * pi
   xn = (1 + (1 * t)) * cos(t) +x
   yn = (1 + (1 * t)) * sin(t) +y
   line x,y,xn,yn
   x = xn : y = yn
   print i + chr(9) + int(x) + chr(9) + int(y) + chr(9) + int(t)    # chr(9) = TAB
   i += 1
end while
imgsave "spiral-Basic-256.png", "PNG" </lang>
Commodore BASIC
Commodore BASIC 2.0 lacks in-built graphics capability. This implementation is written for Commodore BASIC 7.0 that was built into the Commodore 128 computer. Should also work for Commodore BASIC 3.5. <lang basic>1 REM ARCHIMEDEAN SPIRAL 2 REM USING COMMODORE BASIC 7.0 3 REM OF THE COMMODORE 128 4 REM ********************************** 10 GRAPHIC 1,1 20 A = 1.5 30 B = 0.7 40 X0 = 160 : Y0 = 100 50 FOR T = 0 TO 40*π STEP 0.2 60 R = A+B*T 70 X = R*COS(T)+160 : Y = R*SIN(T)+100 80 DRAW 1,X0,Y0 TO X,Y 90 X0 = X : Y0 = Y 100 NEXT T 110 GOTO 110</lang>
FreeBASIC
<lang freebasic>' version 16-10-2016 ' compile with: fbc -s gui
Const As double deg2rad = Atn(1) * 4 / 180 ' pi = atn(1) * 4, pi/180
Const As UInteger screensize = 600 ' size of window in pixels Const As Double turns = 5 ' number of turns Const As UInteger halfscrn = screensize \ 2 Const As uinteger sf = (turns * (screensize - 100)) / halfscrn
ScreenRes screensize, screensize, 32 ' screen 600 * 600 pixels, 4 byte color
Dim As Double r, x, y
For r = 0 To turns * 360 Step 0.05
 x = Cos(r * deg2rad) * r / sf
 y = Sin(r * deg2rad) * r / sf
 PSet(halfscrn + x, halfscrn - y), RGB(255, 255, 255)
Next
' empty keyboard buffer
While InKey <> "" : Wend
Print : Print "hit any key to end program"
Sleep
End</lang>
IS-BASIC
<lang IS-BASIC>100 GRAPHICS LORES 2 110 OPTION ANGLE DEGREES 120 PLOT 640,360,ANGLE 90; 130 FOR I=2 TO 33.2 STEP .05 140 PLOT FORWARD I,LEFT 5; 150 NEXT</lang>
Run BASIC
<lang Run BASIC> 'archimedean spiral.bas
   'runs in Run Basic
   'Run Basic website http://www.runbasic.com
   'From Rosettacode.org/wiki/ *** Liberty_BASIC
 graphic #g, 300,300 'width and height - the center is 150
 c = 255  '255 for white '0 for black
 print "Welcome to the Arch-Spiral Program"
 pi=acs(-1)
 nLoops = 5
  #g cls("blue") 'blue background color
  #g color(c,c,c) 'set line color - see color above
 for t=0 to 2*pi*nLoops step 0.01
    'c = c - 1  'changes color parameter
    x=100*t/(2*pi*nLoops)*cos(t)+150  '150x150 is the center
    y=100*t/(2*pi*nLoops)*sin(t)+150
    #g color(c,c,c)  'changes color
    #g set(x,y)
    'if c <1 then c=255
 next
   render #g
 print "Thank you and Goodbye"
 end
End</lang>
QBASIC
<lang basic>SCREEN 12 WINDOW (-2.67, -2!)-(2.67, 2!) PI = 4 * ATN(1) H = PI / 40 A = .2: B = .05 PSET (A, 0) FOR I = 0 TO 400
   T = I * H
   X = (A + B * T) * COS(T)
   Y = (A + B * T) * SIN(T)
   LINE -(X, Y)
NEXT</lang>
Sinclair ZX81 BASIC
Works with the unexpanded (1k RAM) ZX81. The output is quite blocky, but identifiably a spiral. <lang basic>10 LET A=1.5 20 LET B=0.7 30 FOR T=0 TO 7*PI STEP 0.05 40 LET R=A+B*T 50 PLOT R*COS T+32,R*SIN T+22 60 NEXT T</lang>
- Output:
Screenshot here.
C
Interactive code which asks the parameters a and b as inputs, the number of cycles and the division steps. Requires the WinBGIm library. <lang C>
- include<graphics.h>
- include<stdio.h>
- include<math.h>
- define pi M_PI
int main(){ double a,b,cycles,incr,i;
int steps,x=500,y=500;
printf("Enter the parameters a and b : "); scanf("%lf%lf",&a,&b);
printf("Enter cycles : "); scanf("%lf",&cycles);
printf("Enter divisional steps : "); scanf("%d",&steps);
incr = 1.0/steps;
initwindow(1000,1000,"Archimedean Spiral");
for(i=0;i<=cycles*pi;i+=incr){ putpixel(x + (a + b*i)*cos(i),x + (a + b*i)*sin(i),15); }
getch();
closegraph(); } </lang>
C++

<lang cpp>
- include <windows.h>
- include <string>
- include <iostream>
const int BMP_SIZE = 600;
class myBitmap { public:
   myBitmap() : pen( NULL ), brush( NULL ), clr( 0 ), wid( 1 ) {}
   ~myBitmap() {
       DeleteObject( pen ); DeleteObject( brush );
       DeleteDC( hdc ); DeleteObject( bmp );
   }
   bool create( int w, int h ) {
       BITMAPINFO bi;
       ZeroMemory( &bi, sizeof( bi ) );
       bi.bmiHeader.biSize        = sizeof( bi.bmiHeader );
       bi.bmiHeader.biBitCount    = sizeof( DWORD ) * 8;
       bi.bmiHeader.biCompression = BI_RGB;
       bi.bmiHeader.biPlanes      = 1;
       bi.bmiHeader.biWidth       =  w;
       bi.bmiHeader.biHeight      = -h;
       HDC dc = GetDC( GetConsoleWindow() );
       bmp = CreateDIBSection( dc, &bi, DIB_RGB_COLORS, &pBits, NULL, 0 );
       if( !bmp ) return false;
       hdc = CreateCompatibleDC( dc );
       SelectObject( hdc, bmp );
       ReleaseDC( GetConsoleWindow(), dc );
       width = w; height = h;
       return true;
   }
   void clear( BYTE clr = 0 ) {
       memset( pBits, clr, width * height * sizeof( DWORD ) );
   }
   void setBrushColor( DWORD bClr ) {
       if( brush ) DeleteObject( brush );
       brush = CreateSolidBrush( bClr );
       SelectObject( hdc, brush );
   }
   void setPenColor( DWORD c ) {
       clr = c; createPen();
   }
   void setPenWidth( int w ) {
       wid = w; createPen();
   }
   void saveBitmap( std::string path ) {
       BITMAPFILEHEADER fileheader;
       BITMAPINFO       infoheader;
       BITMAP           bitmap;
       DWORD            wb;
       GetObject( bmp, sizeof( bitmap ), &bitmap );
       DWORD* dwpBits = new DWORD[bitmap.bmWidth * bitmap.bmHeight];
       ZeroMemory( dwpBits, bitmap.bmWidth * bitmap.bmHeight * sizeof( DWORD ) );
       ZeroMemory( &infoheader, sizeof( BITMAPINFO ) );
       ZeroMemory( &fileheader, sizeof( BITMAPFILEHEADER ) );
       infoheader.bmiHeader.biBitCount = sizeof( DWORD ) * 8;
       infoheader.bmiHeader.biCompression = BI_RGB;
       infoheader.bmiHeader.biPlanes = 1;
       infoheader.bmiHeader.biSize = sizeof( infoheader.bmiHeader );
       infoheader.bmiHeader.biHeight = bitmap.bmHeight;
       infoheader.bmiHeader.biWidth = bitmap.bmWidth;
       infoheader.bmiHeader.biSizeImage = bitmap.bmWidth * bitmap.bmHeight * sizeof( DWORD );
       fileheader.bfType    = 0x4D42;
       fileheader.bfOffBits = sizeof( infoheader.bmiHeader ) + sizeof( BITMAPFILEHEADER );
       fileheader.bfSize    = fileheader.bfOffBits + infoheader.bmiHeader.biSizeImage;
       GetDIBits( hdc, bmp, 0, height, ( LPVOID )dwpBits, &infoheader, DIB_RGB_COLORS );
       HANDLE file = CreateFile( path.c_str(), GENERIC_WRITE, 0, NULL, CREATE_ALWAYS,
                                 FILE_ATTRIBUTE_NORMAL, NULL );
       WriteFile( file, &fileheader, sizeof( BITMAPFILEHEADER ), &wb, NULL );
       WriteFile( file, &infoheader.bmiHeader, sizeof( infoheader.bmiHeader ), &wb, NULL );
       WriteFile( file, dwpBits, bitmap.bmWidth * bitmap.bmHeight * 4, &wb, NULL );
       CloseHandle( file );
       delete [] dwpBits;
   }
   HDC getDC() const     { return hdc; }
   int getWidth() const  { return width; }
   int getHeight() const { return height; }
private:
   void createPen() {
       if( pen ) DeleteObject( pen );
       pen = CreatePen( PS_SOLID, wid, clr );
       SelectObject( hdc, pen );
   }
   HBITMAP bmp; HDC    hdc;
   HPEN    pen; HBRUSH brush;
   void    *pBits; int    width, height, wid;
   DWORD    clr;
}; class spiral { public:
   spiral() {
       bmp.create( BMP_SIZE, BMP_SIZE );
   }
   void draw( int c, int s ) {
       double a = .2, b = .3, r, x, y;
       int w = BMP_SIZE >> 1;
       HDC dc = bmp.getDC();
       for( double d = 0; d < c * 6.28318530718; d += .002 ) {
           r = a + b * d; x = r * cos( d ); y = r * sin( d );
           SetPixel( dc, ( int )( s * x + w ), ( int )( s * y + w ), 255 );
       }
       // saves the bitmap
       bmp.saveBitmap( "./spiral.bmp" );
   }
private:
myBitmap bmp;
}; int main(int argc, char* argv[]) {
spiral s; s.draw( 16, 8 ); return 0;
} </lang>
C#
<lang csharp>using System; using System.Linq; using System.Drawing; using System.Diagnostics; using System.Drawing.Drawing2D;
class Program {
   const int width = 380;
   const int height = 380;
   static PointF archimedeanPoint(int degrees)
   {
       const double a = 1;
       const double b = 9;
       double t = degrees * Math.PI / 180;
       double r = a + b * t;
       return new PointF { X = (float)(width / 2 + r * Math.Cos(t)), Y = (float)(height / 2 + r * Math.Sin(t)) };
   }
   static void Main(string[] args)
   {
       var bm = new Bitmap(width, height);
       var g = Graphics.FromImage(bm);
       g.SmoothingMode = SmoothingMode.AntiAlias;
       g.FillRectangle(new SolidBrush(Color.White), new Rectangle { X = 0, Y = 0, Width = width, Height = height });
       var pen = new Pen(Color.OrangeRed, 1.5f);
       var spiral = Enumerable.Range(0, 360 * 3).AsParallel().AsOrdered().Select(archimedeanPoint);
       var p0 = new PointF(width / 2, height / 2);
       foreach (var p1 in spiral)
       {
           g.DrawLine(pen, p0, p1);
           p0 = p1;
       }
       g.Save(); // is this really necessary ?
       bm.Save("archimedes-csharp.png");
       Process.Start("archimedes-csharp.png"); // Launches default photo viewing app
   }
} </lang>
Common Lisp
Common Lisp doesn't provide native graphical output. Libraries or bitmapped output could be used instead, but for this solution, the output is accomplished with character printing.
<lang lisp>(defun draw-coords-as-text (coords size fill-char)
 (let* ((min-x (apply #'min (mapcar #'car coords)))
        (min-y (apply #'min (mapcar #'cdr coords)))
        (max-x (apply #'max (mapcar #'car coords)))
        (max-y (apply #'max (mapcar #'cdr coords)))
        (real-size (max (+ (abs min-x) (abs max-x)) ; bounding square
                        (+ (abs min-y) (abs max-y))))
        (scale-factor (* (1- size) (/ 1 real-size)))
        (center-x (* scale-factor -1 min-x))
        (center-y (* scale-factor -1 min-y))
        (intermediate-result (make-array (list size size)
                                         :element-type 'char
                                         :initial-element #\space)))
   (dolist (c coords)
     (let ((final-x (floor (+ center-x (* scale-factor (car c)))))
           (final-y (floor (+ center-y (* scale-factor (cdr c))))))
       (setf (aref intermediate-result final-x final-y)
             fill-char)))
   ; print results to output
   (loop for i below (array-total-size intermediate-result) do
         (when (zerop (mod i size))
           (terpri))
         (princ (row-major-aref intermediate-result i)))))
(defun spiral (a b step-resolution step-count)
 "Returns a list of coordinates for r=a+b*theta stepping theta by step-resolution"
 (loop for theta
       from 0 upto (* step-count step-resolution)
       by step-resolution
       for r = (+ a (* b theta))
       for x = (* r (cos theta))
       for y = (* r (sin theta))
       collect (cons x y)))
(draw-coords-as-text (spiral 10 10 0.01 1500) 30 #\*)
- Output
- *
- ****** *
- **** *** **
- *** ** *
- ** ** *
- ** ** *
- * ** **
- ** * *
- ** ****** * *
- * ** ** ** *
- * ** * * *
- * ** * * **
- * * * * *
- * * * ** * *
- * * *** ** *
- * ** * *
- * * ** *
- * ** ** **
- ** ** ** *
- * ** ** **
- ** ******** *
- * **
- ** **
- ** **
- ** ***
- ** **
- **** ***
- *******
</lang>
Component Pascal
<lang oberon2> MODULE ArchimedeanSpiral; IMPORT XYplane, Math;
PROCEDURE Center(x,y: INTEGER); BEGIN XYplane.Dot(XYplane.W DIV 2 + x,XYplane.H DIV 2 + y,XYplane.draw) END Center;
PROCEDURE Do*; VAR x,y: INTEGER; i,t: REAL; BEGIN XYplane.Open; WHILE (i < 200.0) DO t := i / 20 * Math.Pi(); x := SHORT(ENTIER((1.0 + 5.0 * t) * Math.Cos(t))); y := SHORT(ENTIER((1.0 + 5.0 * t) * Math.Sin(t))); Center(x,y); i := i + 0.01; END;
END Do;
END ArchimedeanSpiral. </lang>
Execute: ^Q ArchimedeanSpiral.Do
Frege
<lang frege>module Archimedean where
import Java.IO import Prelude.Math
data BufferedImage = native java.awt.image.BufferedImage where
 pure native type_3byte_bgr "java.awt.image.BufferedImage.TYPE_3BYTE_BGR" :: Int
 native new :: Int -> Int -> Int -> STMutable s BufferedImage
 native createGraphics :: Mutable s BufferedImage -> STMutable s Graphics2D
data Color = pure native java.awt.Color where
 pure native orange "java.awt.Color.orange" :: Color
 pure native white "java.awt.Color.white" :: Color
 pure native new :: Int -> Color
data BasicStroke = pure native java.awt.BasicStroke where
pure native new :: Float -> BasicStroke
data RenderingHints = native java.awt.RenderingHints where
 pure native key_antialiasing "java.awt.RenderingHints.KEY_ANTIALIASING" :: RenderingHints_Key
 pure native value_antialias_on "java.awt.RenderingHints.VALUE_ANTIALIAS_ON" :: Object
data RenderingHints_Key = pure native java.awt.RenderingHints.Key
data Graphics2D = native java.awt.Graphics2D where
 native drawLine :: Mutable s Graphics2D -> Int -> Int -> Int -> Int -> ST s ()
 native drawOval :: Mutable s Graphics2D -> Int -> Int -> Int -> Int -> ST s ()
 native fillRect :: Mutable s Graphics2D -> Int -> Int -> Int -> Int -> ST s ()
 native setColor :: Mutable s Graphics2D -> Color -> ST s ()
 native setRenderingHint :: Mutable s Graphics2D -> RenderingHints_Key -> Object -> ST s ()
 native setStroke :: Mutable s Graphics2D -> BasicStroke -> ST s ()
data ImageIO = mutable native javax.imageio.ImageIO where
native write "javax.imageio.ImageIO.write" :: MutableIO BufferedImage -> String -> MutableIO File -> IO Bool throws IOException
width = 640 center = width `div` 2
roundi = fromIntegral . round
drawGrid :: Mutable s Graphics2D -> ST s () drawGrid g = do
 g.setColor $ Color.new 0xEEEEEE
 g.setStroke $ BasicStroke.new 2
 let angle = toRadians 45
     margin = 10
     numRings = 8
     spacing = (width - 2 * margin) `div` (numRings * 2)
 forM_ [0 .. numRings-1] $ \i -> do
   let pos = margin + i * spacing
       size = width - (2 * margin + i * 2 * spacing)
       ia = fromIntegral i * angle
       multiplier = fromIntegral $ (width - 2 * margin) `div` 2
       x2 = center + (roundi (cos ia * multiplier))
       y2 = center - (roundi (sin ia * multiplier))
   g.drawOval pos pos size size
   g.drawLine center center x2 y2
drawSpiral :: Mutable s Graphics2D -> ST s () drawSpiral g = do
 g.setStroke $ BasicStroke.new 2
 g.setColor $ Color.orange
 let degrees = toRadians 0.1
     end = 360 * 2 * 10 * degrees
     a = 0
     b = 20
     c = 1
     drSp theta = do
       let r = a + b * theta ** (1 / c)
           x = r * cos theta
           y = r * sin theta
           theta' = theta + degrees
       plot g (center + roundi x) (center - roundi y)
       when (theta' < end) (drSp (theta' + degrees))
 drSp 0
plot :: Mutable s Graphics2D -> Int -> Int -> ST s () plot g x y = g.drawOval x y 1 1
main = do
 buffy <- BufferedImage.new width width BufferedImage.type_3byte_bgr
 g <- buffy.createGraphics
 g.setRenderingHint RenderingHints.key_antialiasing RenderingHints.value_antialias_on
 g.setColor Color.white
 g.fillRect 0 0 width width
 drawGrid g
 drawSpiral g
 f <- File.new "SpiralFrege.png"
 void $ ImageIO.write buffy "png" f</lang>
Output is here due to Is file uploading blocked forever?
Go
Creates a PNG file using only built-in packages. <lang go>package main
import ( "image" "image/color" "image/draw" "image/png" "log" "math" "os" )
func main() { const ( width, height = 600, 600 centre = width / 2.0 degreesIncr = 0.1 * math.Pi / 180 turns = 2 stop = 360 * turns * 10 * degreesIncr fileName = "spiral.png" )
img := image.NewNRGBA(image.Rect(0, 0, width, height)) // create new image bg := image.NewUniform(color.RGBA{255, 255, 255, 255}) // prepare white for background draw.Draw(img, img.Bounds(), bg, image.ZP, draw.Src) // fill the background fgCol := color.RGBA{255, 0, 0, 255} // red plot
a := 1.0 b := 20.0
for theta := 0.0; theta < stop; theta += degreesIncr { r := a + b*theta x := r * math.Cos(theta) y := r * math.Sin(theta) img.Set(int(centre+x), int(centre-y), fgCol) }
imgFile, err := os.Create(fileName) if err != nil { log.Fatal(err) } defer imgFile.Close()
if err := png.Encode(imgFile, img); err != nil { imgFile.Close() log.Fatal(err) } }</lang>
Haskell
<lang haskell>#!/usr/bin/env stack -- stack --resolver lts-7.0 --install-ghc runghc --package Rasterific --package JuicyPixels
import Codec.Picture( PixelRGBA8( .. ), writePng ) import Graphics.Rasterific import Graphics.Rasterific.Texture import Graphics.Rasterific.Transformations
archimedeanPoint a b t = V2 x y
 where r = a + b * t
       x = r * cos t
       y = r * sin t
main :: IO () main = do
 let white = PixelRGBA8 255 255 255 255
     drawColor = PixelRGBA8 0xFF 0x53 0x73 255
     size = 800
     points = map (archimedeanPoint 0 10) [0, 0.01 .. 60]
     hSize = fromIntegral size / 2
     img = renderDrawing size size white $
           withTransformation (translate $ V2 hSize hSize) $
           withTexture (uniformTexture drawColor) $
           stroke 4 JoinRound (CapRound, CapRound) $
           polyline points
writePng "SpiralHaskell.png" img</lang>
Output is here due to Is file uploading blocked forever?
J

<lang j>require'plot' 'aspect 1' plot (*^)j.0.01*i.1400</lang>
Java

<lang java>import java.awt.*; import static java.lang.Math.*; import javax.swing.*;
public class ArchimedeanSpiral extends JPanel {
   public ArchimedeanSpiral() {
       setPreferredSize(new Dimension(640, 640));
       setBackground(Color.white);
   }
   void drawGrid(Graphics2D g) {
       g.setColor(new Color(0xEEEEEE));
       g.setStroke(new BasicStroke(2));
double angle = toRadians(45);
       int w = getWidth();
       int center = w / 2;
       int margin = 10;
       int numRings = 8;
int spacing = (w - 2 * margin) / (numRings * 2);
       for (int i = 0; i < numRings; i++) {
           int pos = margin + i * spacing;
           int size = w - (2 * margin + i * 2 * spacing);
           g.drawOval(pos, pos, size, size);
           double ia = i * angle;
           int x2 = center + (int) (cos(ia) * (w - 2 * margin) / 2);
           int y2 = center - (int) (sin(ia) * (w - 2 * margin) / 2);
           g.drawLine(center, center, x2, y2);
       }
   }
   void drawSpiral(Graphics2D g) {
       g.setStroke(new BasicStroke(2));
       g.setColor(Color.orange);
       double degrees = toRadians(0.1);
       double center = getWidth() / 2;
       double end = 360 * 2 * 10 * degrees;
       double a = 0;
       double b = 20;
       double c = 1;
       for (double theta = 0; theta < end; theta += degrees) {
           double r = a + b * pow(theta, 1 / c);
           double x = r * cos(theta);
           double y = r * sin(theta);
           plot(g, (int) (center + x), (int) (center - y));
       }
   }
   void plot(Graphics2D g, int x, int y) {
       g.drawOval(x, y, 1, 1);
   }
   @Override
   public void paintComponent(Graphics gg) {
       super.paintComponent(gg);
       Graphics2D g = (Graphics2D) gg;
       g.setRenderingHint(RenderingHints.KEY_ANTIALIASING,
               RenderingHints.VALUE_ANTIALIAS_ON);
       drawGrid(g);
       drawSpiral(g);
   }
   public static void main(String[] args) {
       SwingUtilities.invokeLater(() -> {
           JFrame f = new JFrame();
           f.setDefaultCloseOperation(JFrame.EXIT_ON_CLOSE);
           f.setTitle("Archimedean Spiral");
           f.setResizable(false);
           f.add(new ArchimedeanSpiral(), BorderLayout.CENTER);
           f.pack();
           f.setLocationRelativeTo(null);
           f.setVisible(true);
       });
   }
}</lang>
JavaScript
<lang html> <html> <head><title>Archimedean spiral</title></head> <body onload="pAS(35,'navy');">
Archimedean spiral
<canvas id="canvId" width="640" height="640" style="border: 2px outset;"></canvas> <script> // Plotting Archimedean_spiral aev 3/17/17 // lps - number of loops, clr - color. function pAS(lps,clr) {
 var a=.0,ai=.1,r=.0,ri=.1,as=lps*2*Math.PI,n=as/ai;
 var cvs=document.getElementById("canvId");
 var ctx=cvs.getContext("2d");
 ctx.fillStyle="white"; ctx.fillRect(0,0,cvs.width,cvs.height);
 var x=y=0, s=cvs.width/2;
 ctx.beginPath();
 for (var i=1; i<n; i++) {
   x=r*Math.cos(a), y=r*Math.sin(a);
   ctx.lineTo(x+s,y+s);
   r+=ri; a+=ai;
 }//fend i
 ctx.strokeStyle = clr; ctx.stroke();
} </script></body></html> </lang>
- Output:
Page with Archimedean spiral like ASjs.png. Right-clicking on the canvas you can save
spiral as a png-file, for example.
Julia
<lang julia>using UnicodePlots
spiral(θ, a=0, b=1) = @. b * θ * cos(θ + a), b * θ * sin(θ + a)
x, y = spiral(1:0.1:10) println(lineplot(x, y))</lang>
- Output:
       ┌────────────────────────────────────────┐
    10 │⠀⠀⠀⠀⠀⠀⠀⠀⠀⠀⠀⠀⠀⠀⠀⠀⠀⠀⠀⠀⡆⠀⠀⠀⠀⠀⠀⠀⠀⠀⠀⠀⠀⠀⠀⠀⠀⠀⠀⠀│
       │⠀⠀⠀⠀⠀⠀⠀⠀⠀⠀⠀⠀⣀⣀⠤⠤⠤⠤⠤⠤⡧⠤⣀⣀⠀⠀⠀⠀⠀⠀⠀⠀⠀⠀⠀⠀⠀⠀⠀⠀│
       │⠀⠀⠀⠀⠀⠀⠀⢀⡠⠔⠊⠉⠀⠀⠀⠀⠀⠀⠀⠀⡇⠀⠀⠀⠉⠓⠤⢄⠀⠀⠀⠀⠀⠀⠀⠀⠀⠀⠀⠀│
       │⠀⠀⠀⠀⠀⡠⠊⠁⠀⠀⠀⠀⠀⠀⠀⠀⠀⠀⠀⠀⡇⠀⠀⠀⠀⠀⠀⠀⠉⠢⡀⠀⠀⠀⠀⠀⠀⠀⠀⠀│
       │⠀⠀⠀⡠⠊⠀⠀⠀⠀⠀⠀⠀⠀⠀⠀⠀⠀⠀⠀⠀⡇⠀⠀⠀⠀⠀⠀⠀⠀⠀⠘⢤⠀⠀⠀⠀⠀⠀⠀⠀│
       │⠀⠀⡜⠀⠀⠀⠀⠀⠀⠀⠀⠀⠀⠀⠀⠀⠀⠀⠀⠀⡇⠀⠀⠀⠀⠀⠀⠀⠀⠀⠀⠀⢇⠀⠀⠀⠀⠀⠀⠀│
       │⠀⡸⠀⠀⠀⠀⠀⠀⠀⠀⠀⠀⠀⠀⣀⠔⠊⠉⠉⠙⣧⡀⠀⠀⠀⠀⠀⠀⠀⠀⠀⠀⢸⠀⠀⠀⠀⠀⠀⠀│
       │⠤⡧⠤⠤⠤⠤⠤⠤⠤⠤⠤⠤⠤⡴⠥⠤⠤⠤⠤⠤⡧⠤⠤⠤⠤⠤⠤⠤⠤⠤⠤⠤⡼⠤⠤⠤⠤⠤⠤⠄│
       │⠀⡇⠀⠀⠀⠀⠀⠀⠀⠀⠀⠀⠀⢣⠀⠀⠀⠀⠀⠀⡇⠀⠀⠀⠀⠀⠀⠀⠀⠀⠀⣰⠁⠀⠀⠀⠀⠀⠀⠀│
       │⠀⢇⠀⠀⠀⠀⠀⠀⠀⠀⠀⠀⠀⠈⢆⠀⠀⠀⠀⠀⡇⠀⠀⠀⠀⠀⠀⠀⠀⣀⠜⠀⠀⠀⠀⠀⠀⠀⠀⠀│
       │⠀⠘⡄⠀⠀⠀⠀⠀⠀⠀⠀⠀⠀⠀⠀⠉⠒⠤⣀⡀⡇⠀⠀⠀⣀⣀⠤⠔⠊⠀⠀⠀⠀⠀⠀⠀⠀⠀⠀⠀│
       │⠀⠀⠘⠀⠀⠀⠀⠀⠀⠀⠀⠀⠀⠀⠀⠀⠀⠀⠀⠈⡏⠉⠉⠉⠀⠀⠀⠀⠀⠀⠀⠀⠀⠀⠀⠀⠀⠀⠀⠀│
       │⠀⠀⠀⠀⠀⠀⠀⠀⠀⠀⠀⠀⠀⠀⠀⠀⠀⠀⠀⠀⡇⠀⠀⠀⠀⠀⠀⠀⠀⠀⠀⠀⠀⠀⠀⠀⠀⠀⠀⠀│
       │⠀⠀⠀⠀⠀⠀⠀⠀⠀⠀⠀⠀⠀⠀⠀⠀⠀⠀⠀⠀⡇⠀⠀⠀⠀⠀⠀⠀⠀⠀⠀⠀⠀⠀⠀⠀⠀⠀⠀⠀│
   -10 │⠀⠀⠀⠀⠀⠀⠀⠀⠀⠀⠀⠀⠀⠀⠀⠀⠀⠀⠀⠀⡇⠀⠀⠀⠀⠀⠀⠀⠀⠀⠀⠀⠀⠀⠀⠀⠀⠀⠀⠀│
       └────────────────────────────────────────┘
       -10                                     10
Kotlin
<lang scala>// version 1.1.0
import java.awt.* import javax.swing.*
class ArchimedeanSpiral : JPanel() {
   init {
       preferredSize = Dimension(640, 640)
       background = Color.white
   }
   private fun drawGrid(g: Graphics2D) {
       g.color = Color(0xEEEEEE)
       g.stroke = BasicStroke(2f)
       val angle = Math.toRadians(45.0)
       val w = width
       val center = w / 2
       val margin = 10
       val numRings = 8
       val spacing = (w - 2 * margin) / (numRings * 2)
       for (i in 0 until numRings) {
           val pos = margin + i * spacing
           val size = w - (2 * margin + i * 2 * spacing)
           g.drawOval(pos, pos, size, size)
           val ia = i * angle
           val x2 = center + (Math.cos(ia) * (w - 2 * margin) / 2).toInt()
           val y2 = center - (Math.sin(ia) * (w - 2 * margin) / 2).toInt()
           g.drawLine(center, center, x2, y2)
       }
   }
   private fun drawSpiral(g: Graphics2D) {
       g.stroke = BasicStroke(2f)
       g.color = Color.magenta
       val degrees = Math.toRadians(0.1)
       val center = width / 2
       val end = 360 * 2 * 10 * degrees
       val a = 0.0
       val b = 20.0
       val c = 1.0
       var theta = 0.0
       while (theta < end) {
           val r = a + b * Math.pow(theta, 1.0 / c)
           val x = r * Math.cos(theta)
           val y = r * Math.sin(theta)
           plot(g, (center + x).toInt(), (center - y).toInt())
           theta += degrees
       }
   }
   private fun plot(g: Graphics2D, x: Int, y: Int) {
       g.drawOval(x, y, 1, 1)
   }
   override fun paintComponent(gg: Graphics) {
       super.paintComponent(gg)
       val g = gg as Graphics2D
       g.setRenderingHint(RenderingHints.KEY_ANTIALIASING, RenderingHints.VALUE_ANTIALIAS_ON)
       drawGrid(g)
       drawSpiral(g)
   }
}
fun main(args: Array<String>) {
   SwingUtilities.invokeLater {
       val f = JFrame()
       f.defaultCloseOperation = JFrame.EXIT_ON_CLOSE
       f.title = "Archimedean Spiral"
       f.isResizable = false
       f.add(ArchimedeanSpiral(), BorderLayout.CENTER)
       f.pack()
       f.setLocationRelativeTo(null)
       f.isVisible = true
   }
}</lang>
Maple
<lang Maple> plots[polarplot](1+2*theta, theta = 0 .. 6*Pi) </lang>
Mathematica
The built-in function PolarPlot easily creates the desired plot <lang Mathematica>With[{a = 5, b = 4}, PolarPlot[a + b t, {t, 0, 10 Pi}]]</lang>
MATLAB
<lang MATLAB>a = 1; b = 1; turns = 2; theta = 0:0.1:2*turns*pi; polarplot(theta, a + b*theta);</lang>
PARI/GP
Note: cartes2() can be found here on PARI/GP page.
<lang parigp> \\ The Archimedean spiral \\ ArchiSpiral() - Where: lps is a number of loops, c is a direction 0/1 \\ (counter-clockwise/clockwise). 6/6/16 aev \\ Note: cartes2() can be found here on \\ http://rosettacode.org/wiki/Polyspiral#PARI.2FGP page. ArchiSpiral(size,lps,c=0)={ my(a=.0,ai=.1,r=.0,ri=.1,as=lps*2*Pi,n=as/ai,x,y,vc,vx=List(.0),vy=vx); if(c<0||c>1, c=0); if(c, ai*=-1); print(" *** The Archimedean spiral: size=",size," loops=",lps," c=",c); for(i=1, n, vc=cartes2(r,a); x=vc[1]; y=vc[2];
   listput(vx,x); listput(vy,y);
   r+=ri; a+=ai;
);\\fend i plothraw(Vec(vx),Vec(vy)); } {\\ Executing: ArchiSpiral(640,5); \\ArchiSpiral1.png ArchiSpiral(640,5,1); \\ArchiSpiral2.png } </lang>
- Output:
> ArchiSpiral(640,5);  \\ArchiSpiral1.png
 *** The Archimedean spiral: size=640 loops=5 c=0
> ArchiSpiral(640,5,1);  \\ArchiSpiral2.png
 *** The Archimedean spiral: size=640 loops=5 c=1
Perl
<lang Perl>use Imager; use constant PI => 3.14159265;
my ($w, $h) = (400, 400); my $img = Imager->new(xsize => $w, ysize => $h);
for ($theta = 0; $theta < 52*PI; $theta += 0.025) {
   $x = $w/2 + $theta * cos($theta/PI);
   $y = $h/2 + $theta * sin($theta/PI);
   $img->setpixel(x => $x, y => $y, color => '#FF00FF');
}
$img->write(file => 'Archimedean-spiral.png'); </lang>
Perl 6
<lang perl6>use Image::PNG::Portable;
my ($w, $h) = (400, 400);
my $png = Image::PNG::Portable.new: :width($w), :height($h);
(0, .025 ... 52*π).race.map: -> \Θ {
$png.set: |((cis( Θ / π ) * Θ).reals »+« ($w/2, $h/2))».Int, 255, 0, 255;
}
$png.write: 'Archimedean-spiral-perl6.png';</lang>
Phix
<lang Phix>-- -- demo\rosetta\Archimedean_spiral.exw -- include pGUI.e
Ihandle dlg, canvas cdCanvas cddbuffer, cdcanvas
function redraw_cb(Ihandle /*ih*/, integer /*posx*/, integer /*posy*/) integer a = 0, b = 5 integer {width, height} = IupGetIntInt(canvas, "DRAWSIZE") integer {centerX,centerY} = sq_floor_div({width,height},2)
   cdCanvasActivate(cddbuffer)
   for deg=0 to 360*7 do
       atom rad = deg*PI/180
       atom r = rad*b + a
       integer x = centerX + floor(r*cos(rad))
       integer y = centerY + floor(r*sin(rad))
       cdCanvasPixel(cddbuffer, x, y, #00FF00)
   end for
   cdCanvasFlush(cddbuffer)
   return IUP_DEFAULT
end function
function map_cb(Ihandle ih)
   cdcanvas = cdCreateCanvas(CD_IUP, ih)
   cddbuffer = cdCreateCanvas(CD_DBUFFER, cdcanvas)
   cdCanvasSetBackground(cddbuffer, CD_WHITE)
   cdCanvasSetForeground(cddbuffer, CD_RED)
   return IUP_DEFAULT
end function
function esc_close(Ihandle /*ih*/, atom c)
   if c=K_ESC then return IUP_CLOSE end if
   return IUP_CONTINUE
end function
procedure main()
IupOpen()
   canvas = IupCanvas(NULL)
   IupSetAttribute(canvas, "RASTERSIZE", "340x340") -- initial size
   IupSetCallback(canvas, "MAP_CB", Icallback("map_cb"))
   dlg = IupDialog(canvas)
   IupSetAttribute(dlg, "TITLE", "Archimedean spiral")
   IupSetCallback(dlg, "K_ANY",     Icallback("esc_close"))
   IupSetCallback(canvas, "ACTION", Icallback("redraw_cb"))
   IupMap(dlg)
   IupSetAttribute(canvas, "RASTERSIZE", NULL) -- release the minimum limitation
   IupShowXY(dlg,IUP_CENTER,IUP_CENTER)
   IupMainLoop()
   IupClose()
end procedure
main()</lang>
PureBasic
<lang PureBasic>#MAXLOOP = 7*360
- XCENTER = 640/2
- YCENTER = 480/2
- SCALAR = 200
If OpenWindow(0, 100, 200, 640, 480, "Archimedean spiral")
 If CreateImage(0, 640, 480,24,RGB(255,255,255))
   If StartDrawing(ImageOutput(0))
     i.f=0.0
     While i<=#MAXLOOP
       x.f=#XCENTER+Cos(Radian(i))*#SCALAR*i/#MAXLOOP
       y.f=#YCENTER+Sin(Radian(i))*#SCALAR*i/#MAXLOOP
       Plot(x,y,RGB(50,50,50))
       i+0.05
     Wend
     StopDrawing()
   EndIf
 EndIf
 ImageGadget(0, 0, 0, 0, 0, ImageID(0))
 Repeat : Event = WaitWindowEvent() : Until Event = #PB_Event_CloseWindow
EndIf End</lang>
Python
Using the turtle module.
<lang python>from turtle import * from math import * color("blue") down() for i in range(200):
   t = i / 20 * pi
   x = (1 + 5 * t) * cos(t)
   y = (1 + 5 * t) * sin(t)
   goto(x, y)
up() done()</lang>
R
<lang r>with(list(s=seq(0, 10 * pi, length.out=500)),
plot((1 + s) * exp(1i * s), type="l"))</lang>
Racket
File:Archemedian-spiral-racket.png <lang racket>#lang racket/base (require plot
racket/math)
- x and y bounds set to centralise the circle
(define (archemedian-spiral-renderer2d a b θ/τ-max
                                      #:samples (samples (line-samples)))
 (define (f θ) (+ a (* b θ)))
 (define max-dim (+ a (* θ/τ-max 2 pi b)))
 (polar f
     0 (* θ/τ-max 2 pi)
     #:x-min (- max-dim)
     #:x-max max-dim
     #:y-min (- max-dim)
     #:y-max  max-dim
     #:samples samples))
(plot (list (archemedian-spiral-renderer2d 0.0 24 4)))
- writes to a file so hopefully, I can post it to RC...
(plot-file (list (archemedian-spiral-renderer2d 0.0 24 4))
"images/archemidian-spiral-racket.png")</lang>
REXX
This REXX version allows the user to specify (or override) the various constants used to calculate and display the spiral (plot).
Note: the value of a doesn't mean that much as the plot is automatically centered. <lang rexx>/*REXX pgm plots several cycles (half a spiral) of the Archimedean spiral (ASCII plot).*/ parse arg cy a b inc chr . /*obtain optional arguments from the CL*/ if cy== | cy=="," then cy= 3 /*Not specified? Then use the default.*/ if a== | a=="," then a= 1 /* " " " " " " */ if b== | b=="," then b= 9 /* " " " " " " */ if inc== | inc=="," then inc= 0.02 /* " " " " " " */ if chr== | chr=="," then chr= '∙' /* " " " " " " */ if length(chr)==3 then chr= d2c(chr) /*plot character coded in decimal? */ if length(chr)==2 then chr= x2c(chr) /* " " " " hexadecimal? */ cy= max(2, cy); LOx= . /*set the LOx variable (a semaphore).*/ parse value scrsize() with sd sw . /*get the size of the terminal screen. */ w= sw - 1 ; mw= w * (cy-1) * 4 /*set useable width; max width for calc*/ h= sd - 1 + cy*10; mh= h * (cy-1) /* " " depth; " depth " " */ @.= /*initialize the line based plot field.*/
        do t=1  to pi()*cy  by inc              /*calc all the coördinates for spiral. */
        r= a +  b*    t                         /*  "   "   "       R       "    "     */
        x= w +  r*cos(t);     xx= x % 2         /*  "   "   "       X       "    "     */
        y= h +  r*sin(t);     yy= y % 2         /*  "   "   "       Y       "    "     */
        if x<0 | y<0 | x>mw | y>mh then iterate /*Is X or Y  out of bounds?  Then skip.*/
        if LOx==.  then do;   LOx=xx;      HIx=xx;      LOy=yy;       HIy=yy
                        end                     /* [↑]  find the minimums and maximums.*/
        LOx= min(LOx, xx);    HIx= max(HIx, xx) /*determine the   X   MIN  and  MAX.   */
        LOy= min(LOy, yy);    HIy= max(HIy, yy) /*    "      "    Y    "    "    "     */
        @.yy= overlay(chr, @.yy, xx+1)          /*assign the plot character (glyph).   */
        end   /*t*/
call plot /*invoke plotting subroutine (to term).*/ exit /*stick a fork in it, we're all done. */ /*──────────────────────────────────────────────────────────────────────────────────────*/ pi: pi=3.1415926535897932384626433832795028841971693993751058209749445923078; return pi plot: do row=HIy to LOy by -1; say substr(@.row, LOx+1); end; return r2r: return arg(1) // (pi() * 2) /*normalize radians ───► a unit circle.*/ /*──────────────────────────────────────────────────────────────────────────────────────*/ cos: procedure; parse arg x; x= r2r(x); a= abs(x); hpi= pi * .5
      numeric fuzz  min(6, digits() - 3);        if a=pi       then return -1
      if a=hpi | a=hpi*3  then return  0         if a=pi / 3   then return .5
      if a=pi * 2 / 3     then return -.5;                          return .sinCos(1, -1)
/*──────────────────────────────────────────────────────────────────────────────────────*/ sin: procedure; parse arg x; x= r2r(x); numeric fuzz min(5, max(1, digits() -3))
      if x=pi * .5         then return 1;        if x==pi*1.5  then return -1
      if abs(x)=pi | x=0   then return 0;                           return  .sinCos(x, 1)
/*──────────────────────────────────────────────────────────────────────────────────────*/ .sinCos: parse arg z 1 _,i; q= x*x
do k=2 by 2 until p=z; p= z; _= -_*q/(k*(k+i)); z= z+_; end; return z</lang>
- output when using the following inputs: 13 , 5 , db
(Output is shown at 1/20 size.)
█ █ █ ██ █
█ █ █ █ █ █ █ █ █ █
█ █ █ █ █
█ █ █ █ █
█ █ █
█ █ █ █
█ █ █
█ █
█ █ █
█ ██
█ █
█ █
█ █
█ █
█ █
█ █
█ █ █ ██ █ ██ █ ██ █ █
█ ██ █ █ ██ █ █ █
█ █ ██ █ ██ █
█ ██ █ █ █
█ █ █ █ █
█ █ █ █ █
█ █ █ █ █
█ ██ █ █
█ █ ██ █
█ █ █
██ █ █
█ █ █ █
█ █ █ █ █
█ █
█ █ █ █
█ █ █ █
█ █ ███ ███ ███ ███ ███ █ █
█ █ ███ ███ █ █
█ █ █ ██ ██ █ █ █
█ █ ██ ██ █ █
█ ██ █ ██ █
█ █ ██ █ █ █
█ ██ █ █ █ █
█ █ ██ ██ █
█ █ █ █
█ ██ ██ █ █
█ █ █ █ █
█ █ ██ █ █
█ █ █ █ █ █
█ █ █ █ █
█ █ ██ █
█ █ █ █████ █ █ █
█ █ ███████ ███████ █ █ █
█ █ ████ ████ █ █
█ █ █ ███ ████ █ █
█ █ ███ ██ █ █ █
█ █ █ ██ ███ █ █
█ ██ ██ █ █ █
█ █ █ ██ ██ █
█ █ █ █ █ █ █
█ █ ██ █ █ █ █
█ █ █ ██ █ █
█ █ █ ██ ██ █ █
█ █ █ █ █ █
█ █ ██ ██ █ █ █
█ █ █ █ █ █
█ ██ ██ █ █ █
█ █ █ █ ████████████ █ █ █ █
█ █ █████ ████ ██ █
█ █ █ ███ ████ █ █ █ █
█ █ █ ███ ███ █ █ █
█ █ █ █ ██ ███ █ █
█ █ ██ ██ █ █ █
█ █ █ ███ ██ █ █ █ █
█ █ ██ █ █ █
█ █ █ █ ██ ██ █ █ █ █
█ █ ██ █ ██ █ █ █
█ █ █ █ ██ █ █
█ █ █ ██ █ █ █ █
█ █ █ █ █ ██ █ █ █
█ █ █ ██ █ █ █
█ █ █ █ ██ █ █ █ █
█ ██ █ █ █ █ █
█ █ █ █ █ ████████████ █ █
█ █ █ █ ███ ███ █ █ █ █ █
█ █ █ █ ██ ███ █ ██ █ █
█ █ █ ██ ██ █ █ █ █
█ █ █ █ ██ ██ ██ █ █ █
█ █ █ █ ██ ██ █ █ █ █
█ █ █ █ █ ██ ██ █ █ █
█ █ ██ █ █ █ █ █ █
█ █ █ █ █ ██ █ █ █ █
█ █ ██ ██ █ █ █ █ █
█ █ █ █ █ █ █ █ █ █
█ █ █ ██ ██ █ █ █
█ █ █ █ █ █ █ █ █ █ █ █
█ █ █ █ █ █ █ █ █ █
█ █ █ █ ██ █ █ █ █
█ █ █ █ ██ █████ █ █ █ █
█ █ █ █ █ ███ ███ █ █ █ █ █
█ █ █ █ ██ █ █ █ █ █ █
█ █ █ █ █ █ █ █ █ █ █ █ █
█ █ █ █ ██ █ █ █
█ █ █ █ █ █ █ █ █ █ █ █ █
█ █ █ ██ █ █ █ █
█ █ █ █ █ █ █ █ █ █ █
█ █ █ █ █ █ █ █ █ █
█ █ █ █ █ ██ █ █ █ █
█ █ █ █ █ █ █ █ █ █
█ █ █ █ ██ ██ █ █ █ █ █
█ █ █ █ █ ██ █ █ █ █
█ █ █ █ ██ █ █ █ █ █
█ █ █ █ █ ██ █ █ █ █ █
█ █ ██ ██ ██ █ █ █
█ █ █ █ ███ ███ ██ █ █ █ █
█ █ █ █ █ █████ █████ █ █ █ █
█ █ █ █ ███ ██ ██ █ █
█ █ █ █ █ █ █ █
█ █ █ █ █ █ █ █
█ █ █ █ █ ██ █ █
█ █ █ █ ██ █ █ █ █
█ █ █ █ █ █ █ █
█ █ █ █ ██ █ █ █ █
█ █ █ ██ █ █ █ █ █
█ █ █ ██ █ █ █
█ █ ██ ██ ██ █ █ █
█ █ █ ██ ██ ██ █ █
█ █ █ █ ██ ██ █ █ █ █
█ █ ██ ███ █ █
█ █ █ ██ ███ ████ ██ █ █ █
█ █ █ ████ ████ █ █ █
█ █ █ █ █████████████ █ █ █
█ █ █ ██ █ █ █
█ █ ██ █ █ █
█ █ █ █ ██ █ █
█ █ ██ █ █
█ █ ██ █ █ █ █
█ █ █ ██ █ █ █
█ ██ █ ██ █ █
█ █ █ ██ █ █ █ █
█ ██ ██ █ █
█ █ █ ██ █ █ █ █
█ █ █ ███ ███ █
█ █ ██ ██ █ █ █
█ █ █ ███ ████ █ █ █
█ ██ ████ ███ █ █
█ █ ██████ ██████ █ █
█ █ █ ██████████ █ █
█ █ ██ █ █
█ █ ██ █ █ █
█ █ █ █ █
█ ██ ██ █ █
█ █ █
█ █ ██ ██ █ █
█ █ █ █ █
█ █ ██ ██ █
█ █ ██ █ █ █ █
█ █ ██ ██ █ █
█ ██ ██ █
█ █ ███ ███ █ █
█ █ ██ █ ███ █ █
█ ████ ███ █ █
█ █ ██ ████ ██████ ██████ █
█ █ █ █
█ ██ █ █
█ █
█ █ █ █ █
█ █ █ █
█ ██ █ █
█ █ ██ █
██ █
█ █ ██ █
█ ██ █ █
█ █ █ ██ █
█ █ █ ██ █
█ ██ ██ █
█ ██ █ ██ █
█ █ ██ █ ██ ██ █
█ █ ██ ██ ██ ██ ██ ██ █
█ █
█ █
█ █
█ █ █
█ █
█ █
█ █ █
█ █ █
█ █
██ █ █
█ █ █
██ ██
█ █ █ █
██ █ ██ █
█ █ ██ █ █ █ █
█ █ █ ██ █ █ █ █
Ring
<lang ring> /*
+---------------------------------------------------------------------------------------------------------
+     Program Name : Archimedean spiral
+---------------------------------------------------------------------------------------------------------
- /
Load "guilib.ring"
horzSize = 400 vertSize = 400
counter = 0 ### cycle thru colors colorRed = new qcolor() { setrgb(255,000,000,255) } colorGreen = new qcolor() { setrgb(000,255,000,255) } colorBlue = new qcolor() { setrgb(000,000,255,255) } colorYellow = new qcolor() { setrgb(255,255,000,255) }
penUseR = new qpen() { setcolor(colorRed) setwidth(1) } penUseG = new qpen() { setcolor(colorGreen) setwidth(1) } penUseB = new qpen() { setcolor(colorBlue) setwidth(1) } penUseY = new qpen() { setcolor(colorYellow) setwidth(1) }
       deg2rad    = atan(1) * 4 / 180
       screensize = 600
       turns      = 5
       halfscrn   = screensize / 2
       sf         = (turns * (screensize - 100)) / halfscrn
       x = 1
       y = 1
       r = 0
       inc = 0.50   ### control increment speed of r
New qapp {
  win1 =  new qwidget()
   {
       setwindowtitle("Draw Spiral")
       setgeometry(100,100,600,600)

      label1 = new qlabel(win1)
      {
          setgeometry(10,10,600,600)
          settext("")
      }


      Canvas = new qlabel(win1)
      {
           MonaLisa = new qPixMap2( 600,600)
           color    = new qcolor(){ setrgb(255,0,0,255) }
           daVinci  = new qpainter()
           {
              begin(MonaLisa)
              penUse = new qpen() { setcolor(colorRed) setwidth(1) }
              setpen(penUseR)
              #endpaint()      ### This will Stop the Painting
           }

           setpixmap(MonaLisa)
      }

       oTimer = new qTimer(win1)
       {
           setinterval(1)    ### 1 millisecond
           settimeoutevent("DrawCounter()")
           start()
       }

      show()   ### Will show Painting ONLY after exec
   }
  exec()
}
- ====================================================
Func DrawCounter()
   x  = cos(r * deg2rad) * r / sf
   y  = sin(r * deg2rad) * r / sf
   r += inc   ###  0.20 fast, 0.90 slow
       if r >= turns * 360
           r = inc
           x = 1
           y = 1
           counter++
           whichColor = counter % 4
           See  "whichColor: "+ whichColor +nl
               if whichColor = 0 daVinci.setpen(penUseR)  ok
               if whichColor = 1 daVinci.setpen(penUseG)  ok
               if whichColor = 2 daVinci.setpen(penUseB)  ok
               if whichColor = 3 daVinci.setpen(penUseY)  ok
ok
   hpoint = halfscrn + x
   ypoint = halfscrn - y
   daVinci.drawpoint(hpoint, ypoint)
   Canvas.setpixmap(MonaLisa)          ### Need this setpixmap to display imageLabel
   win1.show()                         ### Need this show to display imageLabel
return </lang>
Rust
<lang rust>#[macro_use(px)] extern crate bmp;
use bmp::{Image, Pixel}; use std::f64;
fn main() {
   let width = 600u32;
   let half_width = (width / 2) as i32;
   let mut img = Image::new(width, width);
   let draw_color = px!(255, 128, 128);
   // Constants defining the spiral size.
   let a = 1.0_f64;
   let b = 9.0_f64;
   // max_angle = number of spirals * 2pi.
   let max_angle = 5.0_f64 * 2.0_f64 * f64::consts::PI;
   let mut theta = 0.0_f64;
   while theta < max_angle {
       theta = theta + 0.002_f64;
       let r = a + b * theta;
       let x = (r * theta.cos()) as i32 + half_width;
       let y = (r * theta.sin()) as i32 + half_width;
       img.set_pixel(x as u32, y as u32, draw_color);
   }
   // Save the image
   let _ = img.save("archimedean_spiral.bmp").unwrap_or_else(|e| panic!("Failed to save: {}", e));
}</lang>
SAS
<lang sas>data xy; h=constant('pi')/40; do i=0 to 400;
   t=i*h;
   x=(1+t)*cos(t);
   y=(1+t)*sin(t);
   output;
end; keep x y; run;
proc sgplot; series x=x y=y; run;</lang>
Scala
Java Swing Interoperability
<lang Scala>
object ArchimedeanSpiral extends App {
 SwingUtilities.invokeLater(() =>
   new JFrame("Archimedean Spiral") {
     class ArchimedeanSpiral extends JPanel {
       setPreferredSize(new Dimension(640, 640))
       setBackground(Color.white)
       private def drawGrid(g: Graphics2D): Unit = {
         val (angle, margin, numRings) = (toRadians(45), 10, 8)
         val w = getWidth
         val (center, spacing) = (w / 2, (w - 2 * margin) / (numRings * 2))
         g.setColor(new Color(0xEEEEEE))
         for (i <- 0 until numRings) {
           val pos = margin + i * spacing
           val size = w - (2 * margin + i * 2 * spacing)
           g.drawOval(pos, pos, size, size)
           val ia = i * angle
           val x2 = center + (cos(ia) * (w - 2 * margin) / 2).toInt
           val y2 = center - (sin(ia) * (w - 2 * margin) / 2).toInt
           g.drawLine(center, center, x2, y2)
         }
       }
       private def drawSpiral(g: Graphics2D): Unit = {
         val (degrees: Double, center) = (toRadians(0.1), getWidth / 2)
         val (a, b, c, end) = (0, 20, 1, 360 * 2 * 10 * degrees)
def plot(g: Graphics2D, x: Int, y: Int): Unit = g.drawOval(x, y, 1, 1)
         def iter(theta: Double): Double = {
           if (theta < end) {
             val r = a + b * pow(theta, 1 / c)
             val x = r * cos(theta)
             val y = r * sin(theta)
             plot(g, (center + x).toInt, (center - y).toInt)
             iter(theta + degrees)
           } else theta
         }
         g.setStroke(new BasicStroke(2))
         g.setColor(Color.orange)
         iter(0)
       }
       override def paintComponent(gg: Graphics): Unit = {
         super.paintComponent(gg)
         val g = gg.asInstanceOf[Graphics2D]
         g.setRenderingHint(RenderingHints.KEY_ANTIALIASING, RenderingHints.VALUE_ANTIALIAS_ON)
         drawGrid(g)
         drawSpiral(g)
       }
     }
     add(new ArchimedeanSpiral, BorderLayout.CENTER)
     pack()
     setDefaultCloseOperation(WindowConstants.EXIT_ON_CLOSE)
     setLocationRelativeTo(null)
     setResizable(false)
     setVisible(true)
   }
 )
}</lang>
Scilab
<lang>a = 3; b = 2;
theta = linspace(0,10*%pi,1000); r = a + b .* theta;
//1. Plot using polar coordinates scf(1); polarplot(theta,r);
//2. Plot using rectangular coordinates //2.1 Convert coordinates using Euler's formula z = r .* exp(%i .* theta); x = real(z); y = imag(z);
scf(2); plot2d(x,y);</lang>
Scheme
<lang scheme> (import (scheme base)
       (scheme complex)
       (rebottled pstk))
- settings for spiral
(define *resolution* 0.01) (define *count* 2000) (define *a* 10) (define *b* 10) (define *center*
 (let ((size 200)) ; change this to alter size of display
   (* size 1+i)))
(define (draw-spiral canvas)
 (define (coords theta)
   (let ((r (+ *a* (* *b* theta))))
     (make-polar r theta)))
 ;
 (do ((i 0 (+ i 1))) ; loop to draw spiral
   ((= i *count*) )
   (let ((c (+ (coords (* i *resolution*)) *center*)))
     (canvas 'create 'line
             (real-part c) (imag-part c)
             (+ 1 (real-part c)) (imag-part c)))))
(let ((tk (tk-start)))
 (tk/wm 'title tk "Archimedean Spiral")
 (let ((canvas (tk 'create-widget 'canvas)))
   (tk/pack canvas)
   (canvas 'configure
           'height: (* 2 (real-part *center*))
           'width: (* 2 (imag-part *center*)))
   (draw-spiral canvas))
 (tk-event-loop tk))
</lang>
Sidef
<lang ruby>require('Imager') define π = Num.pi
var (w, h) = (400, 400) var img = %O<Imager>.new(xsize => w, ysize => h)
for Θ in (0 .. 52*π -> by(0.025)) {
   img.setpixel(
       x => floor(cos(Θ / π)*Θ + w/2),
       y => floor(sin(Θ / π)*Θ + h/2),
       color => [255, 0, 0]
   )
}
img.write(file => 'Archimedean_spiral.png')</lang> Output image: Archimedean spiral
Stata
<lang stata>clear all scalar h=_pi/40 set obs 400 gen t=_n*h gen x=(1+t)*cos(t) gen y=(1+t)*sin(t) line y x</lang>
Tcl
This creates a little Tk GUI where you can interactively enter values for `a` and `b`. The spiral will be re-drawn automatically thanks to `trace`:
<lang Tcl>package require Tk
- create widgets
canvas .canvas frame .controls
ttk::label .legend -text " r = a + b θ " ttk::label .label_a -text "a =" ttk::entry .entry_a -textvariable a ttk::label .label_b -text "a =" ttk::entry .entry_b -textvariable b button .button -text "Redraw" -command draw
- layout
grid .canvas .controls -sticky nsew grid .legend - -sticky ns -in .controls grid .label_a .entry_a -sticky nsew -in .controls grid .label_b .entry_b -sticky nsew -in .controls grid .button - -sticky ns -in .controls
- make the canvas resize with the window
grid columnconfigure . 0 -weight 1 grid rowconfigure . 0 -weight 1
- spiral parameters:
set a .2 set b .05
proc draw {} {
   variable a
   variable b
   # make sure inputs are valid:
   if {![string is double $a] || ![string is double $b]} return
   if {$a == 0 || $b == 0} return
   set w [winfo width .canvas]
   set h [winfo height .canvas]
   set r 0
   set pi [expr {4*atan(1)}]
   set step [expr {$pi / $w}]
   for {set t 0} {$r < 2} {set t [expr {$t + $step}]} {
       set r [expr {$a + $b * $t}]
       set y [expr {sin($t) * $r}]
       set x [expr {cos($t) * $r}]
       # transform to canvas co-ordinates
       set y [expr {entier((1+$y)*$h/2)}]
       set x [expr {entier((1+$x)*$w/2)}]
       lappend coords $x $y
   }
   .canvas delete all
   set id [.canvas create line $coords -fill red]
}
- draw whenever parameters are changed
- ";#" so extra trace arguments are ignored
trace add variable a write {draw;#} trace add variable b write {draw;#}
wm protocol . WM_DELETE_WINDOW exit ;# exit when window is closed
update ;# lay out widgets before trying to draw draw vwait forever ;# go into event loop until window is closed</lang>
VBA
<lang vb>Private Sub plot_coordinate_pairs(x As Variant, y As Variant)
   Dim chrt As Chart
   Set chrt = ActiveSheet.Shapes.AddChart.Chart
   With chrt
       .ChartType = xlXYScatter
       .HasLegend = False
       .SeriesCollection.NewSeries
       .SeriesCollection.Item(1).XValues = x
       .SeriesCollection.Item(1).Values = y
   End With
End Sub Public Sub main()
   Dim x(1000) As Single, y(1000) As Single
   a = 1
   b = 9
   For i = 0 To 1000
       theta = i * WorksheetFunction.Pi() / 60
       r = a + b * theta
       x(i) = r * Cos(theta)
       y(i) = r * Sin(theta)
   Next i
   plot_coordinate_pairs x, y
End Sub</lang>
Yabasic
<lang Yabasic>5 OPEN WINDOW 320, 200 : WINDOW ORIGIN "CC" 10 LET A=1.5 20 LET B=0.7 30 FOR T=0 TO 30*PI STEP 0.05 40 LET R=A+B*T 50 LINE TO R*COS(T),R*SIN(T) 60 NEXT T</lang>
zkl

Uses the PPM class from http://rosettacode.org/wiki/Bitmap/Bresenham%27s_line_algorithm#zkl <lang zkl>fcn archimedeanSpiral(a,b,circles){
  w,h:=640,640; centerX,centerY:=w/2,h/2;
  bitmap:=PPM(w+1,h+1,0xFF|FF|FF);  // White background
  foreach deg in ([0.0 .. 360*circles]){
     rad:=deg.toRad();
     r:=rad*b + a;
     x,y:=r.toRectangular(rad);
     bitmap[centerX + x, centerY + y] = 0x00|FF|00;  // Green dot
  }
  bitmap.writeJPGFile("archimedeanSpiral.jpg");
}(0,5,7);</lang>
- Programming Tasks
- Solutions by Programming Task
- AWK
- BASIC
- Applesoft BASIC
- BASIC256
- Commodore BASIC
- FreeBASIC
- IS-BASIC
- Run BASIC
- QBASIC
- Sinclair ZX81 BASIC
- C
- C++
- C sharp
- Common Lisp
- Component Pascal
- Frege
- Go
- Haskell
- Juicy.Pixels
- Rasterific
- J
- Java
- JavaScript
- Pages with broken file links
- Julia
- Kotlin
- Maple
- Mathematica
- MATLAB
- PARI/GP
- Perl
- Perl 6
- Phix
- PGUI
- PureBasic
- Python
- R
- Racket
- REXX
- Ring
- Rust
- SAS
- Scala
- Scilab
- Scheme
- Scheme/PsTk
- Sidef
- Stata
- Tcl
- VBA
- Yabasic
- Zkl