
Sierpinski curve: Difference between revisions
→{{header|BASIC}}: Added QuickBASIC. |
m →{{header|Quackery}}: added link to description of method |
||
| Line 1,729: | Line 1,729: | ||
=={{header|Quackery}}== |
=={{header|Quackery}}== |
||
Method is described at [[L-system#Quackery]]. |
|||
<syntaxhighlight lang="quackery"> [ $ "turtleduck.qky" loadfile ] now! |
<syntaxhighlight lang="quackery"> [ $ "turtleduck.qky" loadfile ] now! |
||
Latest revision as of 13:54, 14 May 2024
- Task
Produce a graphical or ASCII-art representation of a Sierpinski curve of at least order 3.
11l
T SierpinskiCurve
   . Float x, y
   . Int angle, length

   . F line(out)
      V theta = radians(Float(.angle))
      .x += .length * cos(theta)
      .y -= .length * sin(theta)
      out.write(‘ L’gconvfmt(.x)‘,’gconvfmt(.y))

   . F execute(out, s)
      out.write(‘M’gconvfmt(.x)‘,’gconvfmt(.y))
      L(c) s
         S c
            ‘F’, ‘G’
               .line(out)
            ‘+’
               .angle = (.angle + 45) % 360
            ‘-’
               .angle = (.angle - 45) % 360

   . F :rewrite(s)
      V t = ‘’
      L(c) s
         I c == ‘X’
            t ‘’= ‘XF+G+XF--F--XF+G+X’
         E
            t ‘’= c
      R t

   F write(out, size, length, order)
      .length = length
      .x = length / sqrt(2)
      .y = .x * 2
      .angle = 45
      out.write(‘<svg xmlns='http://www.w3.org/2000/svg' width='’size‘' height='’size"'>\n")
      out.write("<rect width='100%' height='100%' fill='white'/>\n")
      out.write(‘<path stroke-width='1' stroke='black' fill='none' d='’)
      V s = ‘F--XF--F--XF’
      L 0 .< order
         s = .:rewrite(s)
      .execute(out, s)
      out.write("'/>\n</svg>\n")

V out = File(‘sierpinski_curve.svg’, WRITE)
SierpinskiCurve().write(out, 545, 7, 5)- Output:
Same as C++ output.
Action!
Action! language does not support recursion. Therefore an iterative approach with a stack has been proposed.
DEFINE C_="10+"
DEFINE N_="20+"
DEFINE E_="30+"
DEFINE S_="40+"
DEFINE W_="50+"
DEFINE SafePlot="BYTE inside inside=InsideScreen() IF inside THEN Plot(x,y) FI"
DEFINE SafeDrawTo="IF inside=1 AND InsideScreen()=1 THEN DrawTo(x,y) FI"
DEFINE Next="Push(state+1,level)"
DEFINE DrawN="Push(21,level-1)"
DEFINE DrawE="Push(31,level-1)"
DEFINE DrawS="Push(41,level-1)"
DEFINE DrawW="Push(51,level-1)"

INT x,y,stackSize

DEFINE MAX_COUNT="100"
BYTE ARRAY stack(MAX_COUNT)

PROC InitStack()
  stackSize=0
RETURN

BYTE FUNC IsEmpty()
  IF stackSize=0 THEN
    RETURN (1)
  FI
RETURN (0)

PROC Push(BYTE state,level)
  stack(stackSize)=state stackSize==+1
  stack(stackSize)=level stackSize==+1
RETURN

PROC Pop(BYTE POINTER state,level)
  stackSize==-1 level^=stack(stackSize)
  stackSize==-1 state^=stack(stackSize)
RETURN

BYTE FUNC InsideScreen()
  IF x<0 OR y<0 OR x>319 OR y>191 THEN
    RETURN (0)
  FI
RETURN (1)

PROC LineN()
  SafePlot y==-4 SafeDrawTo
RETURN

PROC LineNE()
  SafePlot x==+2 y==-2 SafeDrawTo
RETURN

PROC LineE()
  SafePlot x==+4 SafeDrawTo
RETURN

PROC LineSE()
  SafePlot x==+2 y==+2 SafeDrawTo
RETURN

PROC LineS()
  SafePlot y==+4 SafeDrawTo
RETURN

PROC LineSW()
  SafePlot x==-2 y==+2 SafeDrawTo
RETURN

PROC LineW()
  SafePlot x==-4 SafeDrawTo
RETURN

PROC LineNW()
  SafePlot x==-2 y==-2 SafeDrawTo
RETURN

PROC SierpinskiCurve(BYTE level)
  BYTE state

  InitStack()
  Push(C_ 1,level+1)
  WHILE IsEmpty()=0
  DO
    Pop(@state,@level)
    IF state=C_ 1 THEN
      Next DrawN
    ELSEIF state=C_ 2 THEN
      LineNE() Next DrawE
    ELSEIF state=C_ 3 THEN
      LineSE() Next DrawS
    ELSEIF state=C_ 4 THEN
      LineSW() Next DrawW
    ELSEIF state=C_ 5 THEN
      LineNW()
    ELSEIF state=N_ 1 THEN
      IF level=1 THEN
        LineNE() LineN() LineNW()
      ELSE
        Next DrawN
      FI
    ELSEIF state=N_ 2 THEN
      LineNE() Next DrawE
    ELSEIF state=N_ 3 THEN
      LineN() Next DrawW
    ELSEIF state=N_ 4 THEN
      LineNW()
      DrawN
    ELSEIF state=E_ 1 THEN
      IF level=1 THEN
        LineSE() LineE() LineNE()
      ELSE
        Next DrawE
      FI
    ELSEIF state=E_ 2 THEN
      LineSE() Next DrawS
    ELSEIF state=E_ 3 THEN
      LineE() Next DrawN
    ELSEIF state=E_ 4 THEN
      LineNE() DrawE
    ELSEIF state=S_ 1 THEN
      IF level=1 THEN
        LineSW() LineS() LineSE()
      ELSE
        Next DrawS
      FI
    ELSEIF state=S_ 2 THEN
      LineSW() Next DrawW
    ELSEIF state=S_ 3 THEN
      LineS() Next DrawE
    ELSEIF state=S_ 4 THEN
      LineSE() DrawS
    ELSEIF state=W_ 1 THEN
      IF level=1 THEN
        LineNW() LineW() LineSW()
      ELSE
        Next DrawW
      FI
    ELSEIF state=W_ 2 THEN
      LineNW() Next DrawN
    ELSEIF state=W_ 3 THEN
      LineW() Next DrawS
    ELSEIF state=W_ 4 THEN
      LineSW() DrawW
    ELSE
      Break()
    FI
  OD
RETURN

PROC Main()
  BYTE CH=$02FC,COLOR1=$02C5,COLOR2=$02C6

  Graphics(8+16)
  Color=1
  COLOR1=$0C
  COLOR2=$02

  x=1 y=187
  SierpinskiCurve(6)

  DO UNTIL CH#$FF OD
  CH=$FF
RETURN- Output:
Screenshot from Atari 8-bit computer
ALGOL W
Using code from the Sierpinski arrowhead curve task.
Curve algorithm based on the XPL0 sample.
begin % draw sierpinski curves using ascii art %
    integer CANVAS_WIDTH;
    CANVAS_WIDTH := 200;
    begin
        % the ascii art canvas and related items %
        string(1) array canvas ( 1 :: CANVAS_WIDTH, 1 :: CANVAS_WIDTH );
        integer         heading, asciiX, asciiY, width, maxX, maxY, minX, minY;
        % draw a line using ascii art - the length is ignored and the heading determines the %
        %                               character to use                                     %
        % the position is updated                                                            %
        procedure drawLine( real value length ) ;
            begin
                % stores the min and max coordinates %
                procedure updateCoordinateRange ;
                    begin
                        if asciiX > maxX then maxX := asciiX;
                        if asciiY > maxY then maxY := asciiY;
                        if asciiX < minX then minX := asciiX;
                        if asciiY < minY then minY := asciiY
                    end updateCoordinateRange ;
                if      heading =   0 then begin
                    updateCoordinateRange;
                    canvas( asciiX, asciiY ) := "_";
                    asciiX := asciiX + 1
                    end
                else if heading =  45 then begin
                    updateCoordinateRange;
                    canvas( asciiX, asciiY ) := "/";
                    asciiY := asciiY - 1;
                    asciiX := asciiX + 1
                    end
                else if heading =  90 then begin
                    updateCoordinateRange;
                    canvas( asciiX, asciiY ) := "|";
                    asciiY := asciiY - 1
                    end
                else if heading = 135 then begin
                    asciiX := asciiX - 1;
                    updateCoordinateRange;
                    canvas( asciiX, asciiY ) := "\";
                    asciiY := asciiY - 1
                    end
                else if heading = 180 then begin
                    asciiX := asciiX - 1;
                    updateCoordinateRange;
                    canvas( asciiX, asciiY ) := "_"
                    end
                else if heading = 225 then begin
                    asciiX := asciiX - 1;
                    asciiY := asciiY + 1;
                    updateCoordinateRange;
                    canvas( asciiX, asciiY ) := "/"
                    end
                else if heading = 270 then begin
                    asciiY := asciiY + 1;
                    updateCoordinateRange;
                    canvas( asciiX - 1, asciiY ) := "|";
                    end
                else if heading = 315 then begin
                    asciiY := asciiY + 1;
                    updateCoordinateRange;
                    canvas( asciiX, asciiY ) := "\";
                    asciiX := asciiX + 1
                end if_various_headings
            end drawLine ;
        % changes the heading by the specified angle ( in degrees ) - angle must be +/- 45 %
        procedure turn( integer value angle ) ;
            if angle > 0
            then heading := ( heading + angle ) rem 360
            else begin
                 heading := heading + angle;
                 if heading < 0 then heading := heading + 360
            end tuen ;
        % initialises the ascii art canvas %
        procedure initArt ;
            begin
                heading :=   0;
                asciiX  :=  CANVAS_WIDTH div 2;
                asciiY  := asciiX;
                maxX    := asciiX;
                maxY    := asciiY;
                minX    := asciiX;
                minY    := asciiY;
                for x := 1 until CANVAS_WIDTH do for y := 1 until CANVAS_WIDTH do canvas( x, y ) := " "
            end initArt ;
        % shows the used parts of the canvas %
        procedure drawArt ;
            begin
                for y := minY until maxY do begin
                    write();
                    for x := minX until maxX do writeon( canvas( x, y ) )
                end for_y ;
                write()
            end drawIArt ;
        % draws a sierpinski curve of the specified order and line length %
        procedure sierpinskiCurve( integer value order ) ;
            begin
                % recursively draws a segment of the sierpinski curve %
                procedure curve( integer value order; integer value angle ) ;
                    if 0 not = order then begin
                        turn( + angle );
                        curve( order - 1, - angle );
                        turn( - angle );
                        drawline( 1 );
                        if heading rem 180 = 0 then drawline( 1 );
                        turn( - angle );
                        curve( order - 1, - angle );
                        turn( + angle );
                    end curve ;
                for Quad := 1 until 4 do begin
                    curve( order * 2, 45 );
                    turn( 45 );
                    drawline( 1 );
                    if heading rem 180 = 0 then drawline( 1 );
                    turn( 45 );
                end for_Quad
            end sierpinskiCurve ;
        % draw curves %
        i_w := 1; s_w := 0; % set output formatting %
        for order := 3 do begin
            write( "Sierpinski curve of order ", order );
            write( "===========================" );
            write();
            initArt;
            sierpinskiCurve( order );
            drawArt
        end for_order
    end
end.- Output:
Sierpinski curve of order 3
===========================

/\__/\  /\__/\  /\__/\  /\__/\
\    /  \    /  \    /  \    /
|    |  |    |  |    |  |    |
/ __ \__/ __ \  / __ \__/ __ \
\/  \    /  \/  \/  \    /  \/
    |    |          |    |
/\__/ __ \__/\  /\__/ __ \__/\
\    /  \    /  \    /  \    /
|    |  |    |  |    |  |    |
/ __ \  / __ \__/ __ \  / __ \
\/  \/  \/  \    /  \/  \/  \/
            |    |
/\__/\  /\__/ __ \__/\  /\__/\
\    /  \    /  \    /  \    /
|    |  |    |  |    |  |    |
/ __ \__/ __ \  / __ \__/ __ \
\/  \    /  \/  \/  \    /  \/
    |    |          |    |
/\__/ __ \__/\  /\__/ __ \__/\
\    /  \    /  \    /  \    /
|    |  |    |  |    |  |    |
/ __ \  / __ \  / __ \  / __ \
\/  \/  \/  \/  \/  \/  \/  \/
AutoHotkey
Requires Gdip Library
SierpinskiW	:= 500
SierpinskiH	:= 500
level 		:= 5
cx		:= SierpinskiW/2
cy		:= SierpinskiH
h		:= cx / (2**(level+1))
Arr := []
squareCurve(level)
xmin := xmax := ymin := ymax := 0
for i, point in Arr
{
	xmin := A_Index = 1 ? point.x : xmin < point.x ? xmin : point.x
	xmax := point.x > xmax ? point.x : xmax
	ymin := A_Index = 1 ? point.y : ymin < point.y ? ymin : point.y
	ymax := point.y > ymax ? point.y : ymax
}
SierpinskiX := A_ScreenWidth/2 - (xmax-xmin)/2	, SierpinskiY := A_ScreenHeight/2 - (ymax-ymin)/2
for i, point in Arr
	points .= point.x - xmin + SierpinskiX "," point.y - ymin + SierpinskiY "|"
points := Trim(points, "|")
gdip1()
Gdip_DrawLines(G, pPen, Points)
UpdateLayeredWindow(hwnd1, hdc, 0, 0, Width, Height)
return

; ---------------------------------------------------------------
lineTo(newX, newY) {
	global
	Arr[Arr.count()+1, "x"] := newX-SierpinskiW/2+h
	Arr[Arr.count()  , "y"] := SierpinskiH-newY+2*h
	cx := newX
	cy := newY
}
; ---------------------------------------------------------------
sierN(level) {
	global
	if (level = 1) {
		lineTo(cx+h, cy-h)	; lineNE()
		lineTo(cx, cy-2*h)	; lineN()
		lineTo(cx-h, cy-h)	; lineNW()
	}
	else{
		sierN(level - 1)
		lineTo(cx+h, cy-h)	; lineNE()
		sierE(level - 1)
		lineTo(cx, cy-2*h)	; lineN()
		sierW(level - 1)
		lineTo(cx-h, cy-h)	; lineNW()
		sierN(level - 1)
	}
}
; ---------------------------------------------------------------
sierE(level) {
	global
	if (level = 1) {
		lineTo(cx+h, cy+h)	; lineSE()
		lineTo(cx+2*h, cy)	; lineE()
		lineTo(cx+h, cy-h)	; lineNE()
	}
	else {
		sierE(level - 1)
		lineTo(cx+h, cy+h)	; lineSE()
		sierS(level - 1)
		lineTo(cx+2*h, cy)	; lineE()
		sierN(level - 1)
		lineTo(cx+h, cy-h)	; lineNE()
		sierE(level - 1)
	}
}
; ---------------------------------------------------------------
sierS(level) {
	global
	if (level = 1) {
		lineTo(cx-h, cy+h)	; lineSW()
		lineTo(cx, cy+2*h)	; lineS()
		lineTo(cx+h, cy+h)	; lineSE()
	}
	else {
		sierS(level - 1)
		lineTo(cx-h, cy+h)	; lineSW()
		sierW(level - 1)
		lineTo(cx, cy+2*h)	; lineS()
		sierE(level - 1)
		lineTo(cx+h, cy+h)	; lineSE()
		sierS(level - 1)
	}
}
; ---------------------------------------------------------------
sierW(level) {
	global
	if (level = 1) {
		lineTo(cx-h, cy-h)	; lineNW()
		lineTo(cx-2*h, cy)	; lineW()
		lineTo(cx-h, cy+h)	; lineSW()
	}
	else {
		sierW(level - 1)
		lineTo(cx-h, cy-h)	; lineNW()
		sierN(level - 1)
		lineTo(cx-2*h, cy)	; lineW()
		sierS(level - 1)
		lineTo(cx-h, cy+h)	; lineSW()
		sierW(level - 1)
	}
}
; ---------------------------------------------------------------
squareCurve(level) {
	global
	sierN(level)
	lineTo(cx+h, cy-h)	; lineNE()
	sierE(level)
	lineTo(cx+h, cy+h)	; lineSE()
	sierS(level)
	lineTo(cx-h, cy+h)	; lineSW()
	sierW(level)
	lineTo(cx-h, cy-h)	; lineNW()
	lineTo(cx+h, cy-h)	; lineNE()
}

; ---------------------------------------------------------------
gdip1(){
	global
	If !pToken := Gdip_Startup()
	{
		MsgBox, 48, gdiplus error!, Gdiplus failed to start. Please ensure you have gdiplus on your system
		ExitApp
	}
	OnExit, Exit
	Width := A_ScreenWidth, Height := A_ScreenHeight
	Gui, 1: -Caption +E0x80000 +LastFound +OwnDialogs +Owner +AlwaysOnTop
	Gui, 1: Show, NA
	hwnd1 := WinExist()
	hbm := CreateDIBSection(Width, Height)
	hdc := CreateCompatibleDC()
	obm := SelectObject(hdc, hbm)
	G := Gdip_GraphicsFromHDC(hdc)
	Gdip_SetSmoothingMode(G, 4)
	pPen := Gdip_CreatePen(0xFFFF0000, 2)
}
; ---------------------------------------------------------------
gdip2(){
	global
	Gdip_DeleteBrush(pBrush)
	Gdip_DeletePen(pPen)
	SelectObject(hdc, obm)
	DeleteObject(hbm)
	DeleteDC(hdc)
	Gdip_DeleteGraphics(G)
}
; ---------------------------------------------------------------
Exit:
gdip2()
Gdip_Shutdown(pToken)
ExitApp
Return
BASIC
FreeBASIC
#define pi  4 * Atn(1)
#define yellow  Rgb(255,255,0)

Dim Shared As Integer posX, posY
Dim Shared As Single direc

Sub Dibuja(largo As Integer)
    posX += Fix(largo * Cos(direc))
    posY -= Fix(largo * Sin(direc))
    Line - (posX, posY), yellow
End Sub

Sub Curva(orden As Integer, angulo As Single, long1 As Single, long2 As Single)
    If orden <> 0 Then
        direc += angulo
        Curva(orden-1, -angulo, long1, long2)
        direc -= angulo
        Dibuja(long1)
        direc -= angulo
        Curva(orden-1, -angulo, long1, long2)
        direc += angulo
    End If
End Sub

Screenres 640, 480, 32

Dim As Single ang45 = pi / 4
Dim As Byte orden = 3
Dim As Byte tam = 20
direc = 0
posX = 640/4
posY = 3*480/4
Pset (posX, posY)

For c As Byte = 1 To 4
    Curva(orden*2, ang45, tam/Sqr(2), 5*tam/6)
    direc += ang45
    Dibuja(tam/Sqr(2))
    direc += ang45
Next

Windowtitle "Hit any key to end program"
Sleep
QuickBASIC
REM Sierpinski curve
DECLARE SUB Curve (Lev%, Ang!, L1!, L2!)
DECLARE SUB DrawLine (L!)

CONST Order = 3, Pi = 3.141592654#, Ang45 = Pi / 4!, Size = 20!
CONST Sqr2 = 1.4142135623731#
DIM SHARED Dir, PosX%, PosY%
SCREEN 12
PosX% = 640 \ 4: PosY% = 3 * 480 \ 4
PSET (PosX%, PosY%)
Dir = 0!
FOR Quad% = 1 TO 4
  CALL Curve(Order * 2, Ang45, Size / Sqr2, 5! * Size / 6!)
  Dir = Dir + Ang45
  CALL DrawLine(Size / Sqr2)
  Dir = Dir + Ang45
  NEXT Quad%
END

SUB Curve (Lev%, Ang, L1, L2)
  IF Lev% <> 0 THEN
    Dir = Dir + Ang
    CALL Curve(Lev% - 1, -Ang, L1, L2)
    Dir = Dir - Ang
    CALL DrawLine(L1)
    Dir = Dir - Ang
    CALL Curve(Lev% - 1, -Ang, L1, L2)
    Dir = Dir + Ang
  END IF
END SUB

SUB DrawLine (L)
  PosX% = PosX% + INT(L * COS(Dir) + .5)
  PosY% = PosY% - INT(L * SIN(Dir) + .5)
  LINE -(PosX%, PosY%), 15
END SUB
Yabasic
// Rosetta Code problem: http://rosettacode.org/wiki/Sierpinski_curve
// Adapted from https://www.ocg.at/sites/ocg.at/files/EuroLogo2001/P74Batagelj.pdf to Yabasic by Galileo, 01/2022

import turtle

sub Sierp(n, a, h, k)
    if n = 0 move(k) : return
    turn(a) : Sierp(n - 1, -a, h, k) : turn(-a) : move(h)
    turn(-a) : Sierp(n - 1, -a, h, k) : turn(a)
end sub

sub Sierpinski(n, d)
    local i

    pen(false)
    goxy(10, 680)
    pen(true)
    color 255, 255, 0
    for i = 1 to 4
        Sierp(n, 45, d/sqrt(2), 5*d/6)
        turn(45)
        move(d/sqrt(2))
        turn(45)
    next
end sub

startTurtle()
Sierpinski(9, 12)
C++
Output is a file in SVG format. The curve is generated using the Lindenmayer system method.
// See https://en.wikipedia.org/wiki/Sierpi%C5%84ski_curve#Representation_as_Lindenmayer_system
#include <cmath>
#include <fstream>
#include <iostream>
#include <string>

class sierpinski_curve {
public:
    void write(std::ostream& out, int size, int length, int order);
private:
    static std::string rewrite(const std::string& s);
    void line(std::ostream& out);
    void execute(std::ostream& out, const std::string& s);
    double x_;
    double y_;
    int angle_;
    int length_;
};

void sierpinski_curve::write(std::ostream& out, int size, int length, int order) {
    length_ = length;
    x_ = length/std::sqrt(2.0);
    y_ = 2 * x_;
    angle_ = 45;
    out << "<svg xmlns='http://www.w3.org/2000/svg' width='"
        << size << "' height='" << size << "'>\n";
    out << "<rect width='100%' height='100%' fill='white'/>\n";
    out << "<path stroke-width='1' stroke='black' fill='none' d='";
    std::string s = "F--XF--F--XF";
    for (int i = 0; i < order; ++i)
        s = rewrite(s);
    execute(out, s);
    out << "'/>\n</svg>\n";
}

std::string sierpinski_curve::rewrite(const std::string& s) {
    std::string t;
    for (char c : s) {
        if (c == 'X')
            t += "XF+G+XF--F--XF+G+X";
        else
            t += c;
    }
    return t;
}

void sierpinski_curve::line(std::ostream& out) {
    double theta = (3.14159265359 * angle_)/180.0;
    x_ += length_ * std::cos(theta);
    y_ -= length_ * std::sin(theta);
    out << " L" << x_ << ',' << y_;
}

void sierpinski_curve::execute(std::ostream& out, const std::string& s) {
    out << 'M' << x_ << ',' << y_;
    for (char c : s) {
        switch (c) {
        case 'F':
        case 'G':
            line(out);
            break;
        case '+':
            angle_ = (angle_ + 45) % 360;
            break;
        case '-':
            angle_ = (angle_ - 45) % 360;
            break;
        }
    }
}

int main() {
    std::ofstream out("sierpinski_curve.svg");
    if (!out) {
        std::cerr << "Cannot open output file\n";
        return 1;
    }
    sierpinski_curve s;
    s.write(out, 545, 7, 5);
    return 0;
}
- Output:
Media:Sierpinski_curve_cpp.svg
EasyLang
proc lsysexp level . axiom$ rules$[] .
   for l to level
      an$ = ""
      for c$ in strchars axiom$
         for i = 1 step 2 to len rules$[]
            if rules$[i] = c$
               c$ = rules$[i + 1]
               break 1
            .
         .
         an$ &= c$
      .
      swap axiom$ an$
   .
.
proc lsysdraw axiom$ x y ang lng . .
   linewidth 0.3
   move x y
   for c$ in strchars axiom$
      if c$ = "F" or c$ = "G"
         x += cos dir * lng
         y += sin dir * lng
         line x y
      elif c$ = "-"
         dir -= ang
      elif c$ = "+"
         dir += ang
      .
   .
.
axiom$ = "F--xF--F--xF"
rules$[] = [ "x" "xF+G+xF--F--xF+G+x" ]
lsysexp 5 axiom$ rules$[]
lsysdraw axiom$ 50 98 45 0.9
Factor
USING: accessors kernel L-system sequences ui ;

: curve ( L-system -- L-system )
    L-parser-dialect
    { "G" [ dup length>> draw-forward ] } suffix >>commands
    [ 45 >>angle ] >>turtle-values
    "F--XF--F--XF" >>axiom
    {
        { "X" "XF+G+XF--F--XF+G+X" }
    } >>rules ;

[ <L-system> curve "Sierpinski curve" open-window ] with-ui
When using the L-system visualizer, the following controls apply:
| Button | Command |
|---|---|
| a | zoom in |
| z | zoom out |
| left arrow | turn left |
| right arrow | turn right |
| up arrow | pitch down |
| down arrow | pitch up |
| q | roll left |
| w | roll right |
| Button | Command |
|---|---|
| x | iterate L-system |
Fōrmulæ
Fōrmulæ programs are not textual, visualization/edition of programs is done showing/manipulating structures but not text. Moreover, there can be multiple visual representations of the same program. Even though it is possible to have textual representation —i.e. XML, JSON— they are intended for storage and transfer purposes more than visualization and edition.
Programs in Fōrmulæ are created/edited online in its website.
In this page you can see and run the program(s) related to this task and their results. You can also change either the programs or the parameters they are called with, for experimentation, but remember that these programs were created with the main purpose of showing a clear solution of the task, and they generally lack any kind of validation.
Solution
Recursive

Test cases


L-system
There are generic functions written in Fōrmulæ to compute an L-system in the page L-system.
The program that creates a Sierpiński curve is:


Go
A partial translation anyway which produces a static image of a SC of level 5, yellow on blue, which can be viewed with a utility such as EOG.
package main

import (
    "github.com/fogleman/gg"
    "math"
)

var (
    width  = 770.0
    height = 770.0
    dc     = gg.NewContext(int(width), int(height))
)

var cx, cy, h float64

func lineTo(newX, newY float64) {
    dc.LineTo(newX-width/2+h, height-newY+2*h)
    cx, cy = newX, newY
}

func lineN() { lineTo(cx, cy-2*h) }
func lineS() { lineTo(cx, cy+2*h) }
func lineE() { lineTo(cx+2*h, cy) }
func lineW() { lineTo(cx-2*h, cy) }

func lineNW() { lineTo(cx-h, cy-h) }
func lineNE() { lineTo(cx+h, cy-h) }
func lineSE() { lineTo(cx+h, cy+h) }
func lineSW() { lineTo(cx-h, cy+h) }

func sierN(level int) {
    if level == 1 {
        lineNE()
        lineN()
        lineNW()
    } else {
        sierN(level - 1)
        lineNE()
        sierE(level - 1)
        lineN()
        sierW(level - 1)
        lineNW()
        sierN(level - 1)
    }
}

func sierE(level int) {
    if level == 1 {
        lineSE()
        lineE()
        lineNE()
    } else {
        sierE(level - 1)
        lineSE()
        sierS(level - 1)
        lineE()
        sierN(level - 1)
        lineNE()
        sierE(level - 1)
    }
}

func sierS(level int) {
    if level == 1 {
        lineSW()
        lineS()
        lineSE()
    } else {
        sierS(level - 1)
        lineSW()
        sierW(level - 1)
        lineS()
        sierE(level - 1)
        lineSE()
        sierS(level - 1)
    }
}

func sierW(level int) {
    if level == 1 {
        lineNW()
        lineW()
        lineSW()
    } else {
        sierW(level - 1)
        lineNW()
        sierN(level - 1)
        lineW()
        sierS(level - 1)
        lineSW()
        sierW(level - 1)
    }
}

func squareCurve(level int) {
    sierN(level)
    lineNE()
    sierE(level)
    lineSE()
    sierS(level)
    lineSW()
    sierW(level)
    lineNW()
    lineNE() // needed to close the square in the top left hand corner
}

func main() {
    dc.SetRGB(0, 0, 1) // blue background
    dc.Clear()
    level := 5
    cx, cy = width/2, height
    h = cx / math.Pow(2, float64(level+1))
    squareCurve(level)
    dc.SetRGB255(255, 255, 0) // yellow curve
    dc.SetLineWidth(2)
    dc.Stroke()
    dc.SavePNG("sierpinski_curve.png")
}
Java
import java.io.*;

public class SierpinskiCurve {
    public static void main(final String[] args) {
        try (Writer writer = new BufferedWriter(new FileWriter("sierpinski_curve.svg"))) {
            SierpinskiCurve s = new SierpinskiCurve(writer);
            s.currentAngle = 45;
            s.currentX = 5;
            s.currentY = 10;
            s.lineLength = 7;
            s.begin(545);
            s.execute(rewrite(5));
            s.end();
        } catch (final Exception ex) {
            ex.printStackTrace();
        }
    }

    private SierpinskiCurve(final Writer writer) {
        this.writer = writer;
    }

    private void begin(final int size) throws IOException {
        write("<svg xmlns='http://www.w3.org/2000/svg' width='%d' height='%d'>\n", size, size);
        write("<rect width='100%%' height='100%%' fill='white'/>\n");
        write("<path stroke-width='1' stroke='black' fill='none' d='");
    }

    private void end() throws IOException {
        write("'/>\n</svg>\n");
    }

    private void execute(final String s) throws IOException {
        write("M%g,%g\n", currentX, currentY);
        for (int i = 0, n = s.length(); i < n; ++i) {
            switch (s.charAt(i)) {
                case 'F':
                case 'G':
                    line(lineLength);
                    break;
                case '+':
                    turn(ANGLE);
                    break;
                case '-':
                    turn(-ANGLE);
                    break;
            }
        }
    }

    private void line(final double length) throws IOException {
        final double theta = (Math.PI * currentAngle) / 180.0;
        currentX += length * Math.cos(theta);
        currentY -= length * Math.sin(theta);
        write("L%g,%g\n", currentX, currentY);
    }

    private void turn(final int angle) {
        currentAngle = (currentAngle + angle) % 360;
    }

    private void write(final String format, final Object... args) throws IOException {
        writer.write(String.format(format, args));
    }

    private static String rewrite(final int order) {
        String s = AXIOM;
        for (int i = 0; i < order; ++i) {
            final StringBuilder sb = new StringBuilder();
            for (int j = 0, n = s.length(); j < n; ++j) {
                final char ch = s.charAt(j);
                if (ch == 'X')
                    sb.append(PRODUCTION);
                else
                    sb.append(ch);
            }
            s = sb.toString();
        }
        return s;
    }

    private final Writer writer;
    private double lineLength;
    private double currentX;
    private double currentY;
    private int currentAngle;

    private static final String AXIOM = "F--XF--F--XF";
    private static final String PRODUCTION = "XF+G+XF--F--XF+G+X";
    private static final int ANGLE = 45;
}
- Output:
Media:Sierpinski_curve_java.svg
jq
Works with gojq, the Go implementation of jq
This entry uses an L-system and turtle graphics to generate an SVG file which can be viewed using a web browser, at least if the file type is `.svg`. The SVG viewBox is dynamically sized.
See Category_talk:Jq-turtle for the turtle.jq module used here. Please note that the `include` directive may need to be modified depending on the location of the included file, and the command-line options used.
include "turtle" {search: "."};

# Compute the curve using a Lindenmayer system of rules
def rules:
  { X: "XF+G+XF--F--XF+G+X",
   "": "F--XF--F--XF" };

def sierpinski($count):
  rules as $rules
  | def p($count):
      if $count == 0 then .
      else gsub("X"; $rules["X"]) | p($count-1)
      end;
  $rules[""] | p($count) ;

def interpret($x):
  if   $x == "+" then turtleRotate(45)
  elif $x == "-" then turtleRotate(-45)
  elif $x == "F" or $x == "G" then turtleForward(5)
  else .
  end;

def sierpinski_curve($n):
  sierpinski($n)
  | split("")
  | reduce .[] as $action (
      turtle([100,100]) | turtleDown;
      interpret($action) ) ;

# viewBox = <min-x> <min-y> <width> <height>
# Input: {svg, minx, miny, maxx, maxy}
def svg:
  "<svg viewBox='\(.minx|floor) \(.miny - 2 |floor) \(.maxx - .minx|ceil) \(2 + .maxy - .miny|ceil)'",
  "     preserveAspectRatio='xMinYmin meet'",
  "     xmlns='http://www.w3.org/2000/svg' >",
  path("none"; "red"; 1),
  "</svg>";

sierpinski_curve(5)
| svg
Julia
Turtle procedural (lineto) version
Modified from Craft of Coding blog, Processing version
using Luxor

function sierpinski_curve(x0, y0, h, level)
    x1, y1 = x0, y0
    lineto(x, y) = begin line(Point(x1, y1), Point(x, y), :stroke); x1, y1 = x, y end
    lineN() = lineto(x1,y1-2*h)
    lineS() = lineto(x1,y1+2*h)
    lineE() = lineto(x1+2*h,y1)
    lineW() = lineto(x1-2*h,y1)
    lineNW() = lineto(x1-h,y1-h)
    lineNE() = lineto(x1+h,y1-h)
    lineSE() = lineto(x1+h,y1+h)
    lineSW() = lineto(x1-h,y1+h)
    function drawN(i)
        if i == 1
            lineNE(); lineN(); lineNW()
        else
            drawN(i-1); lineNE(); drawE(i-1); lineN(); drawW(i-1); lineNW(); drawN(i-1)
        end
    end
    function drawE(i)
        if i == 1
            lineSE(); lineE(); lineNE()
        else
            drawE(i-1); lineSE(); drawS(i-1); lineE(); drawN(i-1); lineNE(); drawE(i-1)
        end
    end
    function drawS(i)
        if i == 1
            lineSW(); lineS(); lineSE()
        else
            drawS(i-1); lineSW(); drawW(i-1); lineS(); drawE(i-1); lineSE(); drawS(i-1)
        end
    end
    function drawW(i)
        if i == 1
            lineNW(); lineW(); lineSW()
        else
            drawW(i-1); lineNW(); drawN(i-1); lineW(); drawS(i-1); lineSW(); drawW(i-1)
        end
    end
    function draw_curve(levl)
        drawN(levl); lineNE(); drawE(levl); lineSE()
        drawS(levl); lineSW(); drawW(levl); lineNW()
    end
    draw_curve(level)
end

Drawing(800, 800)
sierpinski_curve(10, 790, 3, 6)
finish()
preview()

LSystem version
using Lindenmayer # https://github.com/cormullion/Lindenmayer.jl

sierpcurve = LSystem(Dict("X" => "XF+G+XF--F--XF+G+X"), "F--XF--F--XF")

drawLSystem(sierpcurve,
    forward = 10,
    turn = 45,
    startingpen= (0.2, 0.8, 0.8),
    startingx = -380,
    startingy = 380,
    startingorientation = π/4,
    iterations = 5,
    filename = "sierpinski_curve.png",
    showpreview = true
)
Lambdatalk
{def sierp
 {def sierp.r
  {lambda {:order :length :angle}
   {if {= :order 0}
    then M:length                            // move :length
    else {sierp.r {- :order 1}               // recurse
                  {/ :length 2}
                  {- :angle}}
         T:angle                             // turn :angle
         {sierp.r {- :order 1}               // recurse
                  {/ :length 2}
                  {+ :angle}}
         T:angle                             // turn :angle
         {sierp.r {- :order 1}               // recurse
                  {/ :length 2}
                  {- :angle}}
 }}}
 {lambda {:order :length}
  {if {= {% :order 2} 0}                     // if :order is even
   then {sierp.r :order :length 60}          // recurse with 60°
   else T60                                  // else turn 60°
        {sierp.r :order :length -60}         // recurse with -60°
}}}

Four curves drawn using the turtle promitive.

{svg {@ width="580" height="580" style="box-shadow:0 0 8px #000;"}

 {polyline  {@ points="{turtle 50 5 0 {sierp 1 570}}"
               stroke="#ccc" fill="transparent" stroke-width="7"}}
 {polyline  {@ points="{turtle 50 5 0 {sierp 3 570}}"
               stroke="#8ff" fill="transparent" stroke-width="5"}}
 {polyline  {@ points="{turtle 50 5 0 {sierp 5 570}}"
               stroke="#f88" fill="transparent" stroke-width="3"}}
 {polyline  {@ points="{turtle 50 5 0 {sierp 7 570}}"
               stroke="#000" fill="transparent" stroke-width="1"}}
}
See the result in http://lambdaway.free.fr/lambdawalks/?view=sierpinsky
Mathematica / Wolfram Language
Graphics[SierpinskiCurve[3]]
Nim
We produce a SVG file using same algorithm as the one of C++ version.
import math

type

  SierpinskiCurve = object
    x, y: float
    angle: float
    length: int
    file: File


proc line(sc: var SierpinskiCurve) =
  let theta = degToRad(sc.angle)
  sc.x += sc.length.toFloat * cos(theta)
  sc.y -= sc.length.toFloat * sin(theta)
  sc.file.write " L", sc.x, ',', sc.y


proc execute(sc: var SierpinskiCurve; s: string) =
  sc.file.write 'M', sc.x, ',', sc.y
  for c in s:
    case c
    of 'F', 'G': sc.line()
    of '+': sc.angle = floorMod(sc.angle + 45, 360)
    of '-': sc.angle = floorMod(sc.angle - 45, 360)
    else: discard


func rewrite(s: string): string =
  for c in s:
    if c == 'X':
      result.add "XF+G+XF--F--XF+G+X"
    else:
      result.add c


proc write(sc: var SierpinskiCurve; size, length, order: int) =
  sc.length = length
  sc.x = length.toFloat / sqrt(2.0)
  sc.y = 2 * sc.x
  sc.angle = 45
  sc.file.write "<svg xmlns='http://www.w3.org/2000/svg' width='", size, "' height='", size, "'>\n"
  sc.file.write "<rect width='100%' height='100%' fill='white'/>\n"
  sc.file.write "<path stroke-width='1' stroke='black' fill='none' d='"
  var s = "F--XF--F--XF"
  for _ in 1..order: s = s.rewrite()
  sc.execute(s)
  sc.file.write "'/>\n</svg>\n"


let outfile = open("sierpinski_curve.svg", fmWrite)
var sc = SierpinskiCurve(file: outfile)
sc.write(545, 7, 5)
outfile.close()
- Output:
Same as C++ output.
Perl
use strict;
use warnings;
use SVG;
use List::Util qw(max min);

use constant pi => 2 * atan2(1, 0);

my $rule = 'XF+F+XF--F--XF+F+X';
my $S = 'F--F--XF--F--XF';
$S =~ s/X/$rule/g for 1..5;

my (@X, @Y);
my ($x, $y) = (0, 0);
my $theta   = pi/4;
my $r       = 6;

for (split //, $S) {
    if (/F/) {
        push @X, sprintf "%.0f", $x;
        push @Y, sprintf "%.0f", $y;
        $x += $r * cos($theta);
        $y += $r * sin($theta);
    }
    elsif (/\+/) { $theta += pi/4; }
    elsif (/\-/) { $theta -= pi/4; }
}

my ($xrng, $yrng) = ( max(@X) - min(@X),  max(@Y) - min(@Y));
my ($xt,   $yt)   = (-min(@X) + 10,      -min(@Y) + 10);

my $svg = SVG->new(width=>$xrng+20, height=>$yrng+20);
my $points = $svg->get_path(x=>\@X, y=>\@Y, -type=>'polyline');
$svg->rect(width=>"100%", height=>"100%", style=>{'fill'=>'black'});
$svg->polyline(%$points, style=>{'stroke'=>'orange', 'stroke-width'=>1}, transform=>"translate($xt,$yt)");

open my $fh, '>', 'sierpinski-curve.svg';
print $fh  $svg->xmlify(-namespace=>'svg');
close $fh;
See: sierpinski-curve.svg (offsite SVG image)
Phix
You can run this online here.
--
-- demo\rosetta\Sierpinski_curve.exw
-- =================================
--
--  Draws curves lo to hi (simultaneously), initially {1,1}, max {8,8}
--  Press +/- to change hi, shift +/- to change lo, ctrl +/- for both.
--  ("=_" are also mapped to "+-", for the non-numpad +/-)
--
with javascript_semantics
include pGUI.e

Ihandle dlg, canvas
cdCanvas cddbuffer, cdcanvas

integer width, height,
        lm = 0, tm = 0, -- left and top margins
        lo = 1, hi = 1
atom cx, cy, h

procedure lineTo(atom newX, newY)
    cdCanvasVertex(cddbuffer, newX-width/2+h+lm, height-newY+2*h+tm)
    cx = newX
    cy = newY
end procedure

procedure lineN() lineTo(cx,cy-2*h) end procedure
procedure lineS() lineTo(cx,cy+2*h) end procedure
procedure lineE() lineTo(cx+2*h,cy) end procedure
procedure lineW() lineTo(cx-2*h,cy) end procedure

procedure lineNW() lineTo(cx-h,cy-h) end procedure
procedure lineNE() lineTo(cx+h,cy-h) end procedure
procedure lineSE() lineTo(cx+h,cy+h) end procedure
procedure lineSW() lineTo(cx-h,cy+h) end procedure

forward procedure sierN(integer level)
forward procedure sierE(integer level)
forward procedure sierS(integer level)
forward procedure sierW(integer level)

procedure sierN(integer level)
   if level=1 then
      lineNE()  lineN()
      lineNW()
   else
      sierN(level-1)  lineNE()
      sierE(level-1)  lineN()
      sierW(level-1)  lineNW()
      sierN(level-1)
   end if
end procedure

procedure sierE(integer level)
   if level=1 then
      lineSE()  lineE()
      lineNE()
   else
      sierE(level-1)  lineSE()
      sierS(level-1)  lineE()
      sierN(level-1)  lineNE()
      sierE(level-1)
   end if
end procedure

procedure sierS(integer level)
   if level=1 then
      lineSW()  lineS()
      lineSE()
   else
      sierS(level-1)  lineSW()
      sierW(level-1)  lineS()
      sierE(level-1)  lineSE()
      sierS(level-1)
   end if
end procedure

procedure sierW(integer level)
   if level=1 then
      lineNW()  lineW()
      lineSW()
   else
      sierW(level-1)  lineNW()
      sierN(level-1)  lineW()
      sierS(level-1)  lineSW()
      sierW(level-1)
   end if
end procedure

procedure sierpinskiCurve(integer level)
   sierN(level)     lineNE()
   sierE(level)     lineSE()
   sierS(level)     lineSW()
   sierW(level)     lineNW()
end procedure

function redraw_cb(Ihandle /*ih*/)
    {width, height} = IupGetIntInt(canvas, "DRAWSIZE")
    if width>height then
        lm = floor((width-height)/2)
        tm = 0
        width = height
    else
        lm = 0
        tm = floor((height-width)/2)
        height = width
    end if
    cdCanvasActivate(cddbuffer)
    for level=lo to hi do
        cx = width/2
        cy = height
        h = cx/power(2,level+1)
        cdCanvasBegin(cddbuffer, CD_CLOSED_LINES)
        sierpinskiCurve(level)
        cdCanvasEnd(cddbuffer)
    end for
    cdCanvasFlush(cddbuffer)
    return IUP_DEFAULT
end function

function map_cb(Ihandle ih)
    cdcanvas = cdCreateCanvas(CD_IUP, ih)
    cddbuffer = cdCreateCanvas(CD_DBUFFER, cdcanvas)
    cdCanvasSetBackground(cddbuffer, CD_WHITE)
    cdCanvasSetForeground(cddbuffer, CD_BLUE)
    return IUP_DEFAULT
end function

procedure set_dlg_title()
    IupSetStrAttribute(dlg, "TITLE", "Sierpinski curve (%d..%d)",{lo,hi})
end procedure

function key_cb(Ihandle /*ih*/, atom c)
    if c=K_ESC then return IUP_CLOSE end if
    if c=K_F5 then return IUP_DEFAULT end if -- (let browser reload work)
    c = iup_XkeyBase(c)
    if find(c,"+=-_") then
        bool bCtrl = IupGetInt(NULL,"CONTROLKEY"),
             bShift = IupGetInt(NULL,"SHIFTKEY")
        if c='+' or c='=' then
            if bCtrl or not bShift then hi = min(8,hi+1) end if
            if bCtrl or     bShift then lo = min(lo+1,hi) end if
        elsif c='-' or c='_' then
            if bCtrl or     bShift then lo = max(1,lo-1) end if
            if bCtrl or not bShift then hi = max(lo,hi-1) end if
        end if
        set_dlg_title()
        cdCanvasClear(cddbuffer)
        IupUpdate(canvas)
    end if
    return IUP_CONTINUE
end function

procedure main()
    IupOpen()
    canvas = IupCanvas("RASTERSIZE=770x770")
    IupSetCallbacks(canvas, {"MAP_CB", Icallback("map_cb"),
                             "ACTION", Icallback("redraw_cb")})
    dlg = IupDialog(canvas)
    IupSetCallback(dlg, "KEY_CB", Icallback("key_cb"))
    set_dlg_title()
    IupShow(dlg)
    IupSetAttribute(canvas, "RASTERSIZE", NULL)
    if platform()!=JS then
        IupMainLoop()
        IupClose()
    end if
end procedure

main()
Processing
// https://rosettacode.org/wiki/Sierpinski_curve#C.2B.2B
// translation of the GO code https://rosettacode.org/wiki/Sierpinski_curve#Go
// output on github at: https://github.com/rupertrussell/sierpinski_curve
// animated gif created using: https://ezgif.com/
int width = 770;
int height = 770;
int level = 6;
float cx = width / 2;
float cy = height;

float oldx = width/2;
float oldy = height;

float h = cx / pow(2, (level+1));
int count = 0;

void setup() {
  size(770, 770);
    noLoop();  // stop draw from looping repeatedly
}

void draw() {
  background(0, 0, 255);  // blue background
  stroke(255, 255, 0); // yellow curve
  squareCurve(level);
  print("count = " , count);
  save("Sierpinski_Curve_Level" + level + ".png");
}
void squareCurve(int level) {
  sierN(level);
  lineNE();
  sierE(level);
  lineSE();
  sierS(level);
  lineSW();
  sierW(level);
  lineNW();
  lineNE(); // needed to close the square in the top left hand corner
}

void lineTo(float newX, float newY) {
  if (count == 0) {
    oldx = newX-width/2+h;
    oldy = height-newY+2*h;
  }
  line(oldx, oldy, newX-width/2+h, height-newY+2*h);
  // save("line-" + count + ".png");  // save each step in drawing the curve
  cx = newX;
  cy = newY;

  oldx = newX-width/2+h;
  oldy = height-newY+2*h;
  count ++;
}

void lineN() {
  lineTo(cx, cy-2*h);
}
void lineS() {
  lineTo(cx, cy+2*h);
}
void lineE() {
  lineTo(cx+2*h, cy);
}
void lineW() {
  lineTo(cx-2*h, cy);
}
void lineNW() {
  lineTo(cx-h, cy-h);
}
void lineNE() {
  lineTo(cx+h, cy-h);
}
void lineSE() {
  lineTo(cx+h, cy+h);
}
void lineSW() {
  lineTo(cx-h, cy+h);
}

void sierN(int level) {
  if (level == 1) {
    lineNE();
    lineN();
    lineNW();
  } else {
    sierN(level - 1);
    lineNE();
    sierE(level - 1);
    lineN();
    sierW(level - 1);
    lineNW();
    sierN(level - 1);
  }
}

void sierE(int level) {
  if (level == 1) {
    lineSE();
    lineE();
    lineNE();
  } else {
    sierE(level - 1);
    lineSE();
    sierS(level - 1);
    lineE();
    sierN(level - 1);
    lineNE();
    sierE(level - 1);
  }
}

void sierS(int level) {
  if (level == 1) {
    lineSW();
    lineS();
    lineSE();
  } else {
    sierS(level - 1);
    lineSW();
    sierW(level - 1);
    lineS();
    sierE(level - 1);
    lineSE();
    sierS(level - 1);
  }
}

void sierW(int level) {
  if ( level == 1) {
    lineNW();
    lineW();
    lineSW();
  } else {
    sierW(level - 1);
    lineNW();
    sierN(level - 1);
    lineW();
    sierS(level - 1);
    lineSW();
    sierW(level - 1);
  }
}- Output:
Offsite image at Sierpinski_Curve_Level5.png Offsite image at Sierpinski_Curve_Level6.png Offsite image at level 5 animated gif
Python
import numpy as np
import matplotlib.pyplot as plt
from matplotlib.colors import hsv_to_rgb as hsv

def curve(axiom, rules, angle, depth):
    for _ in range(depth):
        axiom = ''.join(rules[c] if c in rules else c for c in axiom)

    a, x, y = 0, [0], [0]
    for c in axiom:
        match c:
            case '+':
                a += 1
            case '-':
                a -= 1
            case 'F' | 'G':
                x.append(x[-1] + np.cos(a*angle*np.pi/180))
                y.append(y[-1] + np.sin(a*angle*np.pi/180))

    l = len(x)
    # this is very slow, but pretty colors
    for i in range(l - 1):
        plt.plot(x[i:i+2], y[i:i+2], color=hsv([i/l, 1, .7]))
    plt.gca().set_aspect(1)
    plt.show()

curve('F--XF--F--XF', {'X': 'XF+G+XF--F--XF+G+X'}, 45, 5)
#curve('F+XF+F+XF', {'X': 'XF-F+F-XF+F+XF-F+F-X'}, 90, 5)
#curve('F', {'F': 'G-F-G', 'G': 'F+G+F'}, 60, 7)
#curve('A', {'A': '+BF-AFA-FB+', 'B': '-AF+BFB+FA-'}, 90, 6)
#curve('FX+FX+', {'X': 'X+YF', 'Y': 'FX-Y'}, 90, 12)
Output in the plot window.
Quackery
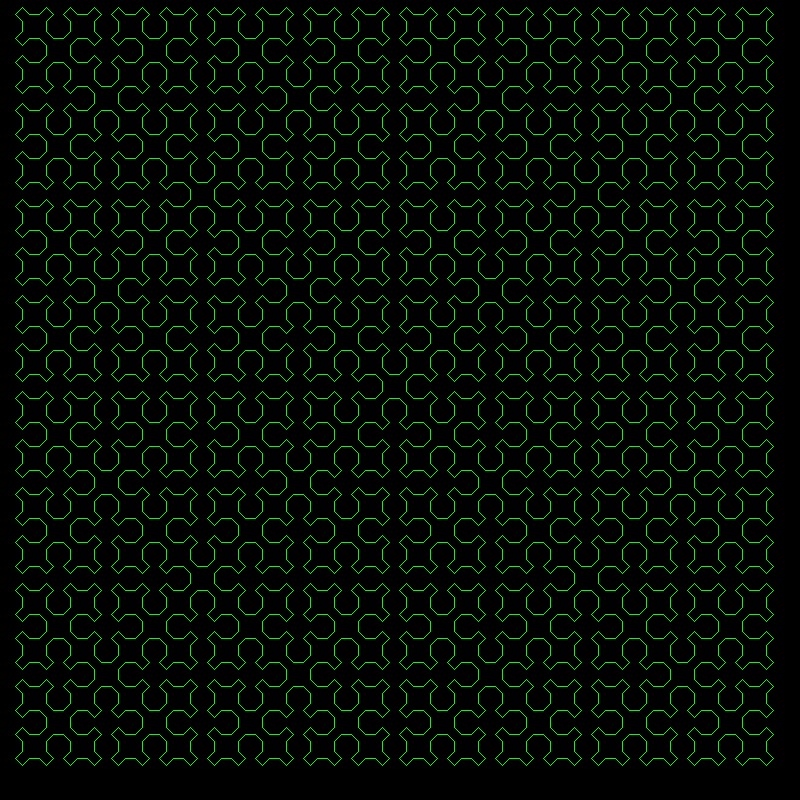
Method is described at L-system#Quackery.
  [ $ "turtleduck.qky" loadfile ] now!

  [ stack ]                      is switch.arg (   --> [ )

  [ switch.arg put ]             is switch     ( x -->   )

  [ switch.arg release ]         is otherwise  (   -->   )

  [ switch.arg share
    != iff ]else[ done
    otherwise ]'[ do ]done[ ]    is case       ( x -->   )

  [ $ "" swap witheach
      [ nested quackery join ] ] is expand     ( $ --> $ )

  [ $ "L" ]                      is L          ( $ --> $ )

  [ $ "R" ]                      is R          ( $ --> $ )

  [ $ "F" ]                      is F          ( $ --> $ )

  [ $ "G" ]                      is G          ( $ --> $ )

  [ $ "AFLGLAFRRFRRAFLGLA" ]     is A          ( $ --> $ )

  $ "FRRAFRRFRRAF"

  5 times expand


  [ $ "turtleduck.qky" loadfile ] now!

  [ stack ]                      is switch.arg (   --> [ )

  [ switch.arg put ]             is switch     ( x -->   )

  [ switch.arg release ]         is otherwise  (   -->   )

  [ switch.arg share
    != iff ]else[ done
    otherwise ]'[ do ]done[ ]    is case       ( x -->   )

  [ $ "" swap witheach
      [ nested quackery join ] ] is expand     ( $ --> $ )

  [ $ "L" ]                      is L          ( $ --> $ )

  [ $ "R" ]                      is R          ( $ --> $ )

  [ $ "F" ]                      is F          ( $ --> $ )

  [ $ "G" ]                      is G          ( $ --> $ )

  [ $ "AFLGLAFRRFRRAFLGLA" ]     is A          ( $ --> $ )

  $ "FRRAFRRFRRAF"

  4 times expand

  turtle
  10 frames
  1 8 turn
  witheach
    [ switch
        [ char L case [ -1 8 turn  ]
          char R case [  1 8 turn  ]
          char A case [ ( ignore ) ]
          otherwise [ 5 1 walk ] ] ]
  -1 8 turn
1 frames- Output:

Raku
(formerly Perl 6)
use SVG;

role Lindenmayer {
    has %.rules;
    method succ {
        self.comb.map( { %!rules{$^c} // $c } ).join but Lindenmayer(%!rules)
    }
}

my $sierpinski = 'F--XF--F--XF' but Lindenmayer( { X => 'XF+G+XF--F--XF+G+X' } );

$sierpinski++ xx 5;

my $dim = 640;
my $scale = 8;
my $dir = pi/4;
my @points = (316, -108);

for $sierpinski.comb {
    state ($x, $y) = @points[0,1];
    state $d = 0;
    when 'F'|'G' { @points.append: ($x += $scale * $d.cos).round(1), ($y += $scale * $d.sin).round(1) }
    when '+' { $d -= $dir }
    when '-' { $d += $dir }
    default { }
}

my $out = './sierpinski-curve-perl6.svg'.IO;

$out.spurt: SVG.serialize(
    svg => [
        :width($dim), :height($dim),
        :rect[:width<100%>, :height<100%>, :fill<black>],
        :polyline[
          :points(@points.join: ','), :fill<black>,
          :transform("rotate(45, 320, 320)"), :style<stroke:#F7DF1E>,
        ],
    ],
);
See: Sierpinski-curve-perl6.svg (offsite SVG image)
Rust
Program output is a file in SVG format.
// [dependencies]
// svg = "0.8.0"

use svg::node::element::path::Data;
use svg::node::element::Path;

struct SierpinskiCurve {
    current_x: f64,
    current_y: f64,
    current_angle: i32,
    line_length: f64,
}

impl SierpinskiCurve {
    fn new(x: f64, y: f64, length: f64, angle: i32) -> SierpinskiCurve {
        SierpinskiCurve {
            current_x: x,
            current_y: y,
            current_angle: angle,
            line_length: length,
        }
    }
    fn rewrite(order: usize) -> String {
        let mut str = String::from("F--XF--F--XF");
        for _ in 0..order {
            let mut tmp = String::new();
            for ch in str.chars() {
                match ch {
                    'X' => tmp.push_str("XF+G+XF--F--XF+G+X"),
                    _ => tmp.push(ch),
                }
            }
            str = tmp;
        }
        str
    }
    fn execute(&mut self, order: usize) -> Path {
        let mut data = Data::new().move_to((self.current_x, self.current_y));
        for ch in SierpinskiCurve::rewrite(order).chars() {
            match ch {
                'F' => data = self.draw_line(data),
                'G' => data = self.draw_line(data),
                '+' => self.turn(45),
                '-' => self.turn(-45),
                _ => {}
            }
        }
        Path::new()
            .set("fill", "none")
            .set("stroke", "black")
            .set("stroke-width", "1")
            .set("d", data)
    }
    fn draw_line(&mut self, data: Data) -> Data {
        let theta = (self.current_angle as f64).to_radians();
        self.current_x += self.line_length * theta.cos();
        self.current_y -= self.line_length * theta.sin();
        data.line_to((self.current_x, self.current_y))
    }
    fn turn(&mut self, angle: i32) {
        self.current_angle = (self.current_angle + angle) % 360;
    }
    fn save(file: &str, size: usize, order: usize) -> std::io::Result<()> {
        use svg::node::element::Rectangle;
        let x = 5.0;
        let y = 10.0;
        let rect = Rectangle::new()
            .set("width", "100%")
            .set("height", "100%")
            .set("fill", "white");
        let mut s = SierpinskiCurve::new(x, y, 7.0, 45);
        let document = svg::Document::new()
            .set("width", size)
            .set("height", size)
            .add(rect)
            .add(s.execute(order));
        svg::save(file, &document)
    }
}

fn main() {
    SierpinskiCurve::save("sierpinski_curve.svg", 545, 5).unwrap();
}
- Output:
Media:Sierpinski_curve_rust.svg
Sidef
Uses the LSystem() class from Hilbert curve.
var rules = Hash(
    x => 'xF+G+xF--F--xF+G+x',
)

var lsys = LSystem(
    width:  550,
    height: 550,

    xoff: -9,
    yoff: -271,

    len:   5,
    angle: 45,
    color: 'dark green',
)

lsys.execute('F--xF--F--xF', 5, "sierpiński_curve.png", rules)
Output image: Sierpiński curve
Wren
import "graphics" for Canvas, Color
import "dome" for Window

var PX = 0
var PY = 0
var CX = 0
var CY = 0
var H  = 0

class SierpinskiCurve {
    construct new(width, height, level, back, fore) {
        Window.title = "Sierpinski Curve"
        Window.resize(width, height)
        Canvas.resize(width, height)
        _w = width
        _h = height
        _l = level
        _bc = back
        _fc = fore
    }

    init() {
        Canvas.cls(Color.blue)
        CX = _w /2
        CY = _h
        H  = CX / 2.pow(_l + 1)
        PX = CX - _w/2 + 2*H
        PY = _h - CY + 3*H
        squareCurve(_l)
    }

    lineTo(newX, newY) {
        Canvas.line(PX, PY, PX = newX - _w/2 + H, PY = _h - newY + 2*H, _fc, 2)
        CX = newX
        CY = newY
    }

    lineN() { lineTo(CX, CY - 2*H) }
    lineS() { lineTo(CX, CY + 2*H) }
    lineE() { lineTo(CX + 2*H, CY) }
    lineW() { lineTo(CX - 2*H, CY) }

    lineNW() { lineTo(CX - H, CY - H) }
    lineNE() { lineTo(CX + H, CY - H) }
    lineSE() { lineTo(CX + H, CY + H) }
    lineSW() { lineTo(CX - H, CY + H) }

    sierN(level) {
        if (level == 1) {
            lineNE()
            lineN()
            lineNW()
        } else {
            sierN(level - 1)
            lineNE()
            sierE(level - 1)
            lineN()
            sierW(level - 1)
            lineNW()
            sierN(level - 1)
        }
    }

    sierE(level) {
        if (level == 1) {
            lineSE()
            lineE()
            lineNE()
        } else {
            sierE(level - 1)
            lineSE()
            sierS(level - 1)
            lineE()
            sierN(level - 1)
            lineNE()
            sierE(level - 1)
        }
    }

    sierS(level) {
        if (level == 1) {
            lineSW()
            lineS()
            lineSE()
        } else {
            sierS(level - 1)
            lineSW()
            sierW(level - 1)
            lineS()
            sierE(level - 1)
            lineSE()
            sierS(level - 1)
        }
    }

    sierW(level) {
        if (level == 1) {
            lineNW()
            lineW()
            lineSW()
        } else {
            sierW(level - 1)
            lineNW()
            sierN(level - 1)
            lineW()
            sierS(level - 1)
            lineSW()
            sierW(level - 1)
        }
    }

    squareCurve(level) {
        sierN(level)
        lineNE()
        sierE(level)
        lineSE()
        sierS(level)
        lineSW()
        sierW(level)
        lineNW()
        lineNE() // needed to close the square in the top left hand corner
    }

    update() {}

    draw(alpha) {}
}

var Game = SierpinskiCurve.new(770, 770, 5, Color.blue, Color.yellow)
- Output:
File:Wren-Sierpinski curve.png
XPL0

int  PosX, PosY;
real Dir;

proc Draw(Len);
real Len;
[PosX:= PosX + fix(Len*Cos(Dir));
 PosY:= PosY - fix(Len*Sin(Dir));
Line(PosX, PosY, $E \yellow\);
];

proc Curve(Lev, Ang, Len1, Len2);
int  Lev;  real Ang, Len1, Len2;
[if Lev # 0 then
    [Dir:= Dir + Ang;
    Curve(Lev-1, -Ang, Len1, Len2);
    Dir:= Dir - Ang;
    Draw(Len1);
    Dir:= Dir - Ang;
    Curve(Lev-1, -Ang, Len1, Len2);
    Dir:= Dir + Ang;
    ];
];

def Order=3, Pi=3.141592654, Ang45=Pi/4.0, Size=20.;
int Quad;
[SetVid($12);   \VGA graphics: 640x480x8
PosX:= 640/4;  PosY:= 3*480/4;
Move(PosX, PosY);
Dir:= 0.;
for Quad:= 1 to 4 do
    [Curve(Order*2, Ang45, Size/Sqrt(2.), 5.*Size/6.);
    Dir:= Dir + Ang45;
    Draw(Size/Sqrt(2.));
    Dir:= Dir + Ang45;
    ];
]
zkl
Uses Image Magick and the PPM class from http://rosettacode.org/wiki/Bitmap/Bresenham%27s_line_algorithm#zkl
sierpinskiCurve(5) : turtle(_,45,45);	// n=5 --> 11,606 characters

fcn sierpinskiCurve(order){
   LSystem("F--XF--F--XF",Dictionary("X","XF+G+XF--F--XF+G+X"), order)
}
fcn LSystem(axiom,rules,order){   // Lindenmayer system
   buf1,buf2 := Data(Void,axiom).howza(3), Data().howza(3);  // characters
   do(order){
      buf1.pump(buf2.clear(),'wrap(c){ rules.find(c,c) });   // change if rule
      t:=buf1; buf1=buf2; buf2=t;	// swap buffers
   }
   buf1
}

fcn turtle(curve,angle,startAngle){  // angles in degrees
   const D=10.0;
   dir:=startAngle;
   img,color := PPM(800,800), 0x00ff00;  // green on black
   x,y := 15, img.h - x;
   foreach c in (curve){
      switch(c){
	 case("F","G"){   // draw forward
	    a,b := D.toRectangular(dir.toFloat().toRad());
	    img.line(x,y, (x+=a.round()),(y+=b.round()), color)
	 }
	 case("+"){ dir=(dir + angle)%360; } // turn left  angle
	 case("-"){ dir=(dir - angle)%360; } // turn right angle
      }
   }
   img.writeJPGFile("sierpinskiCurve.zkl.jpg");
}- Output:
Offsite image at Sierpinski curve order 5